
Figures & data
Figure 1. Capital market line.
Source: Authors.
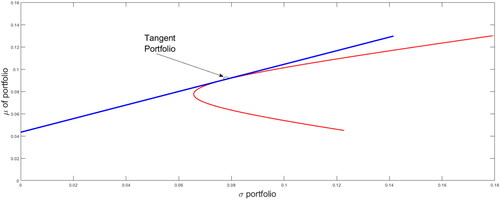
Figure 2. Density of the eigenvalues of the covariance matrix Σ and of a random matrix.
Source: Authors.
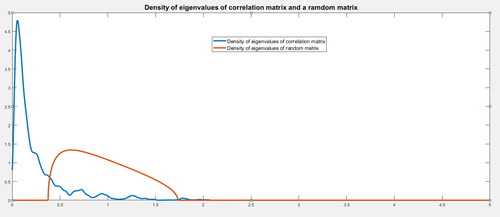
Figure 3. Out-of-sample Sharpe ratio for different shrinkage levels for a sample size of 200.
Source: Authors.
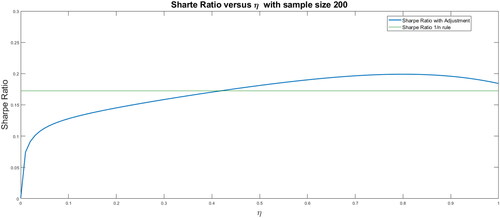
Figure 4. Out-of-sample Sharpe ratio for different shrinkage levels for a sample size of 300.
Source: Authors.
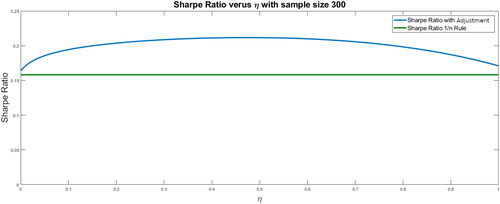
Figure 5. Out-of-sample Sharpe ratio for different shrinkage levels for a sample size of 400.
Source: Authors.
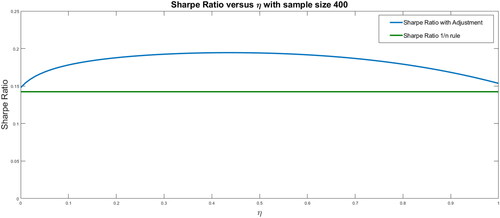
Figure 6. Out-of-sample Sharpe ratio for different shrinkage levels for a sample size of 500.
Source: Authors.
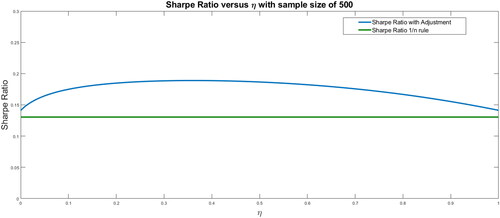
Table 1. Means and standard deviations of the portfolio weights.
Table 2. The effect of the eigenvalues of the covariance matrix.
Figure 7. Density of the eigenvalues for different degrees of compression.
Source: Authors.
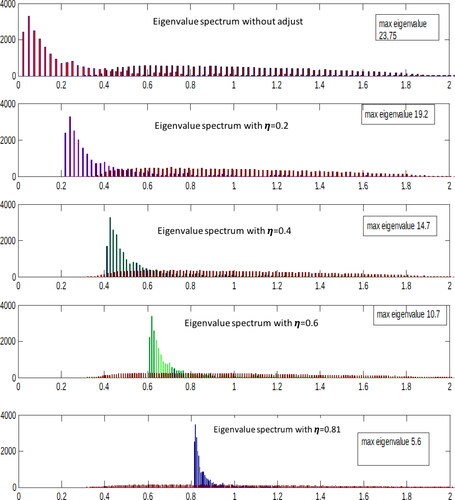
Figure 8. Shrinkage for a sample size of 200 months.
Source: Authors.
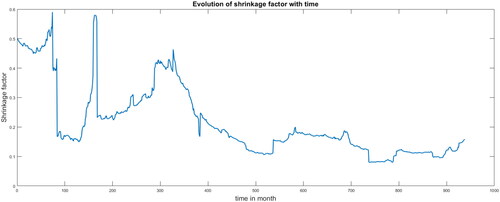
Figure 9. Shrinkage for a sample size of 200 months.
Source: Authors.
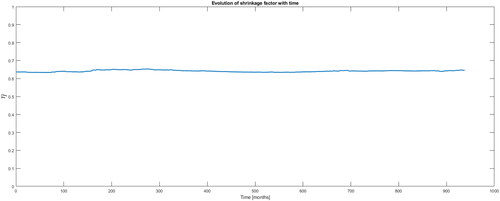
Figure 10. Out of-sample Sharpe ratio versus sample size.
Source: Authors.
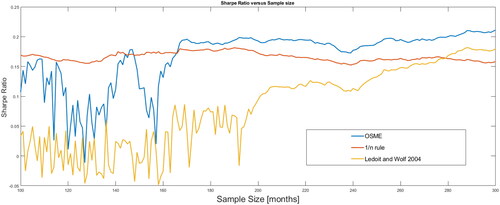
Table 3. Means and standard deviations of the portfolio weights.
Table 4. Out-of-sample performance.
Table 5. Performance measures using the Sharpe and Sortino ratios.
Table 6. Standard deviations of the optimal weights.