
Figures & data
Figure 1. Time series plot of NIFTY and the COVID-19 confirmed cases in India.
Source: Author’s calculation.
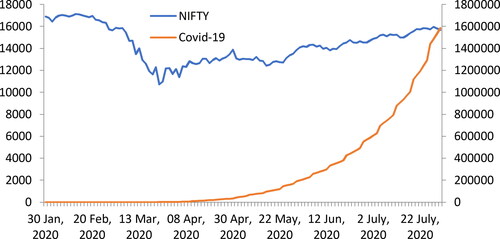
Table 1. Summary statistics of level variables.
Table 2. Results of the unit root tests.
Table 3. Contemporaneous relationship between institutional fund flows and stock return volatility.
Table 4. Contemporaneous relationship between institutional fund flows and stock return volatility with interactive dummies.
Table 5. Dynamics of Interaction between fund flow and volatility (FII's sales on Equity and Debt).
Table 6. Granger causality test.
Table 7. Dynamics of Interaction between fund flow and volatility (MF's investment on Equity and Debt).