
Figures & data
Figure 1. Comparison of China's two-way investment from 2009 to 2016. Source: ‘2017 World Investment Report’ (Unit: USD).
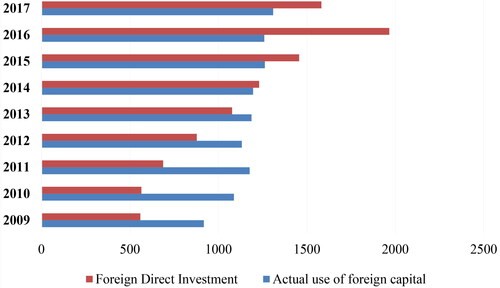
Table 1. Time evolution of total factor productivity in the Belt and Road countries.
Table 2. Panel unit root check.
Table 3. Difference GMM estimation results.
Table 4. Empirical results in Asia and Europe.