
Figures & data
Figure 1. Average of risk governance index from 2005 to 2018.
Source: based on the econometric results obtained.
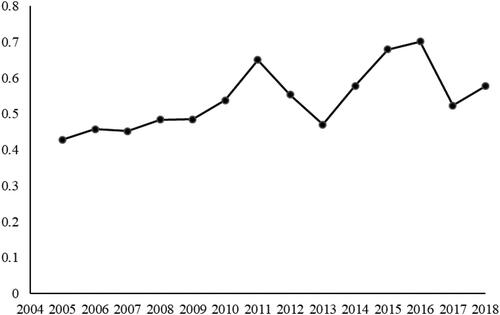
Table 1. Variable definitions and descriptive statistics.
Table 2. Pairwise correlations.
Table 2. Pairwise correlations (continued).
Table 3. Estimation results by pooled OLS.
Table 4. Robustness checks: alternative indicators.
Table 5. Robustness checks: alternative econometric methodologies.