Figures & data
Figure 1. The trend and cycle of the exchange rates. The data sample covers the period from 1998 to 2018, and the data are from IMF (https://www.imf.org/). The nominal exchange rate cycle is HP filtered (λ = 100) and expressed as percentage deviations from the trend. The nominal exchange rate is used with quarterly average data of one U.S. dollar to the Chinese Yuan The real-exchange rate equals the nominal exchange rate multiplied by the U.S. CPI inflation rate (2010 = 100), and then divided by the China CPI inflation rate (2010 = 100). In the figure, the red solid line is calibrated with the ordinate left axis, and the blue dotted line is calibrated with the ordinate right axis.
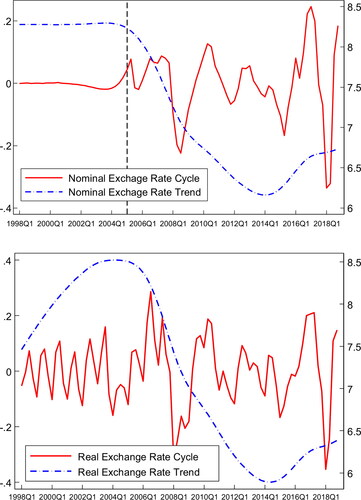
Figure 2. The co-movements of nominal and real-exchange rate cycles. The sample covers the period from 1998 to 2018, and the data are from IMF. Both nominal and real-exchange rate cycles are HP filtered (λ = 100) and expressed as percentage deviations from the trend. The real-exchange rate equals the nominal exchange rate multiplied by the U.S. CPI inflation rate (2010 = 100), and then divided by the China CPI inflation rate (2010 = 100). The nominal exchange rate is used with quarterly average data of one U.S. dollar to the Chinese RMB. In the figure, the red solid line is calibrated with the ordinate left axis, and the blue dotted line is calibrated with the ordinate right axis.
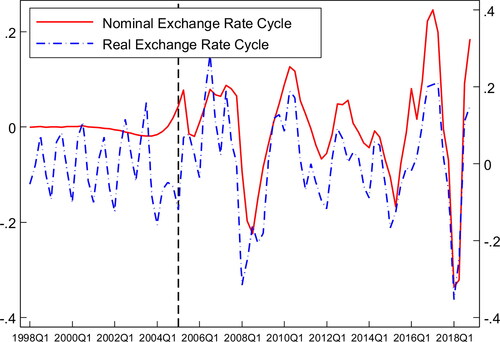
Figure 3. The co-movement fact between U.S. dollar-Chinese yuan nominal exchange rate and U.S. inflation rate. The sample covers the period from 2005 to 2018 and is from IMF. The nominal exchange rate and the U.S. inflation rate are HP filtered (λ = 100) and expressed as percentage deviations from the trend. The nominal exchange rate is used with quarterly average data of one U.S. dollar to the Chinese RMB. The U.S. inflation rate is the CPI inflation rate (2010 = 100), which is from the IMF. In the figure, the red solid line is calibrated with the ordinate left axis, and the blue dotted line is calibrated with the ordinate right axis.
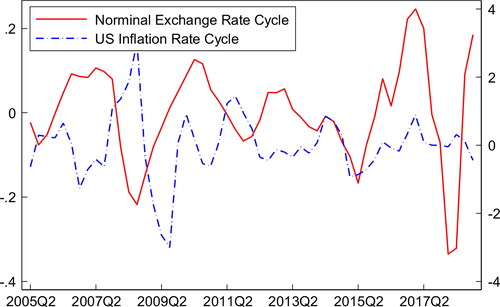
Table 1. Var lag order test.
Table 2. Prior distributions of parameters.
Table 3. Posterior means and standard deviation.
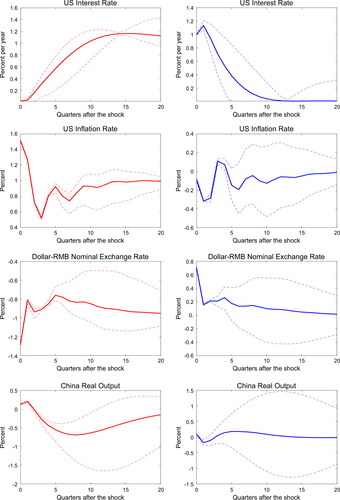
Figure 4. Impulse responses to permanent and transitory U.S. monetary shocks.
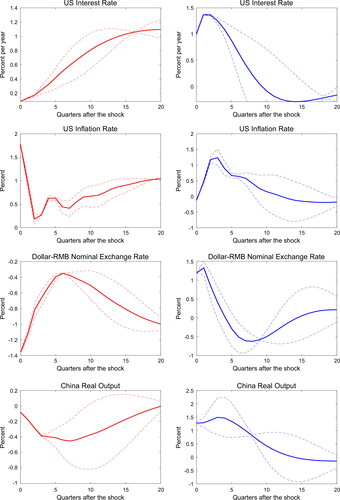
Figure 5. Impulse responses to permanent and transitory U.S. monetary shocks.
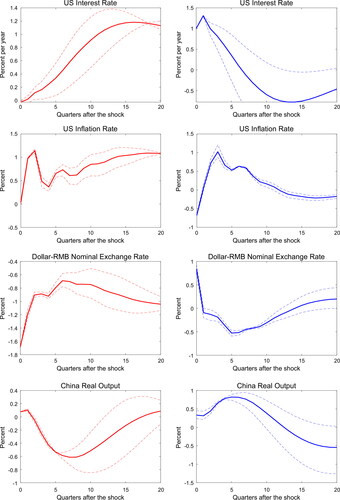
Table 4. Forecast error variance decomposition.
Figure 6. Impulse responses to permanent and temporary U.S. monetary shocks: robustness check 1.
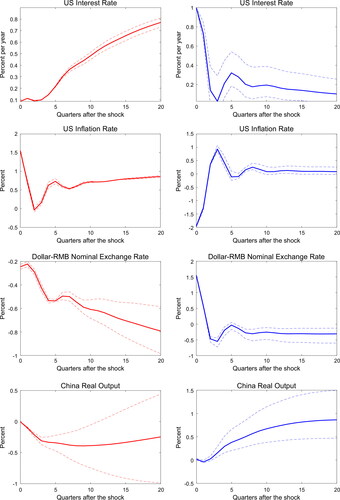
Figure 7. Impulse responses to permanent and temporary U.S. monetary shocks: robustness check 2.