Figures & data
Figure 1. Summary of the research design.
Source: Authors.
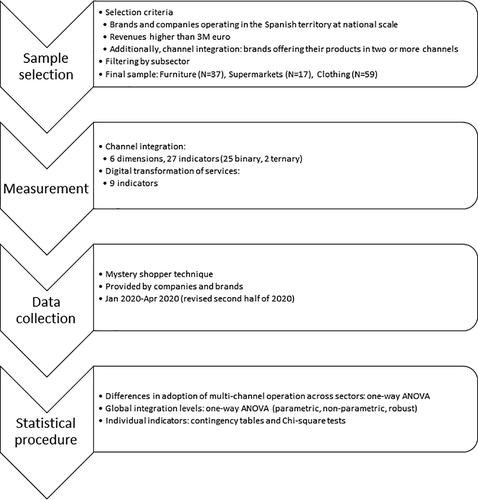
Figure 2. Dimensions and indicators used to measure channel integration.
Source: Authors.
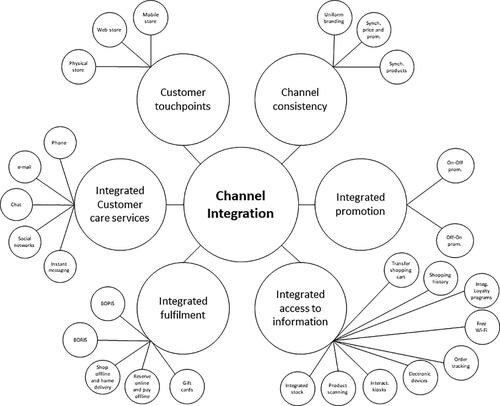
Figure 3. Indicators used to measure digital transformation (implemented digital services).
Source: Authors.
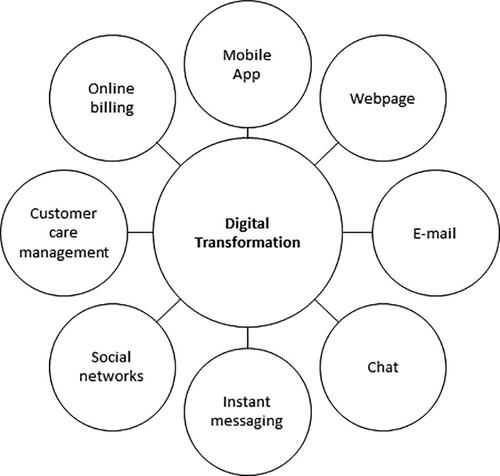
Table 1. Indicators included in the measurement instrument for channel integration and digital transformation in this study.
Figure 4. Distribution of operation channels across the three sectors (left) and results of the one-way ANOVA test (right).
Source: Authors.
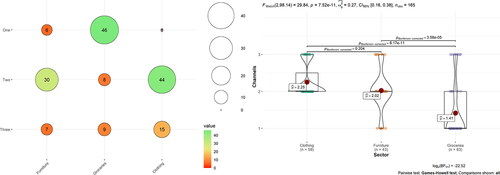
Figure 5. Results of the one-way ANOVA test of channel integration levels across all sectors.
Source: Authors.
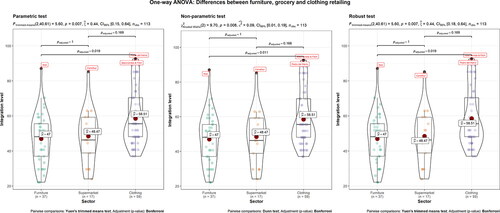
Table 2. Frequencies and contingency tables for each indicator.
Table 3. Significance of the chi-square and post-hoc tests across all the indicators.
Table A1. List of companies included in the study categorized by sector.
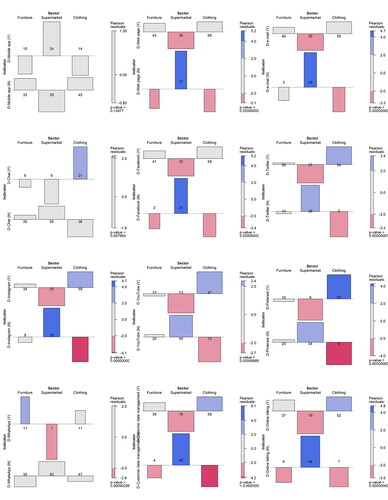
Figure B1. Association plots of customer touchpoints indicators.
Source: Authors.
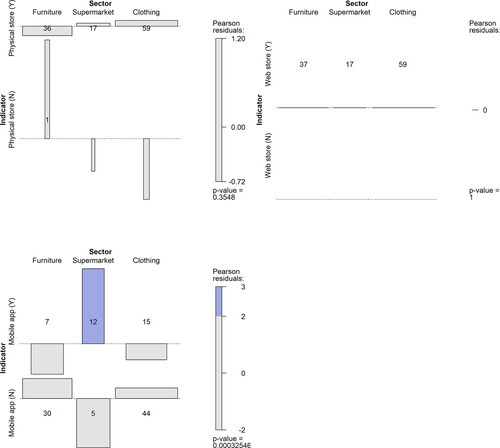
Figure B2. Association plots of channel consistency indicators.
Source: Authors.
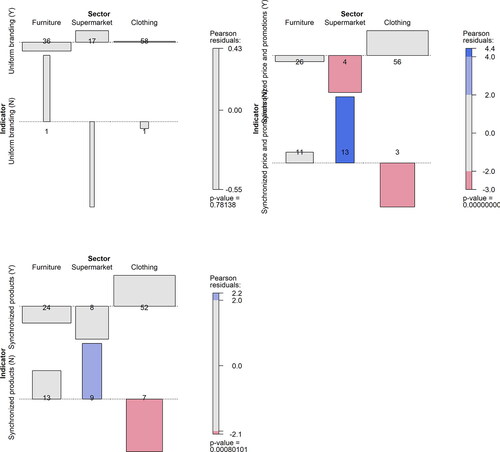
Figure B3. Association plots of integrated promotion indicators.
Source: Authors.
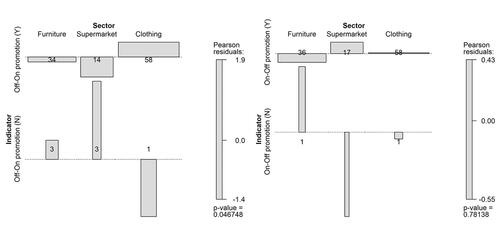
Figure B4. Association plots of integrated access to information indicators.
Source: Authors.
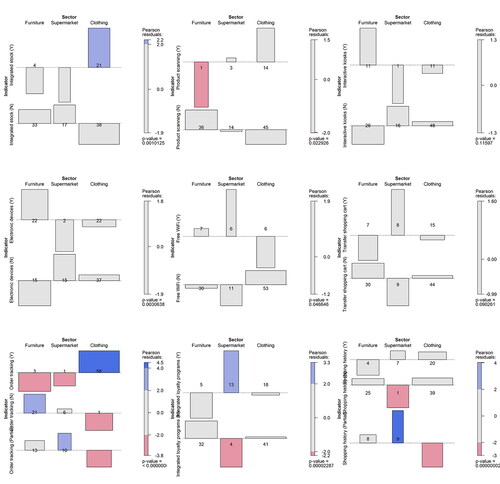
Figure B5. Association plots of integrated fulfilment indicators.
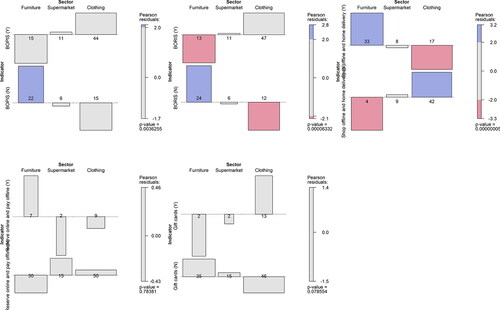
Figure B6. Association plots of integrated customer services indicators.
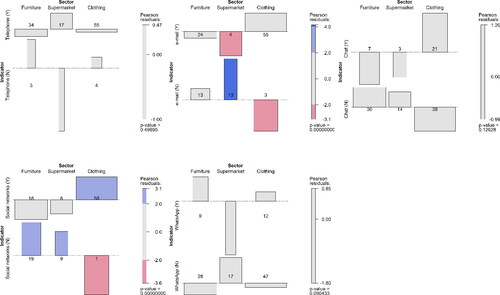
Figure B7. Association plots of digital transformation indicators.