
Figures & data
Figure 1. Different shapes of EKC and PKC hypothesis.
Source: adapted from Dinda (Citation2004), and Aljadani et al. (Citation2021).
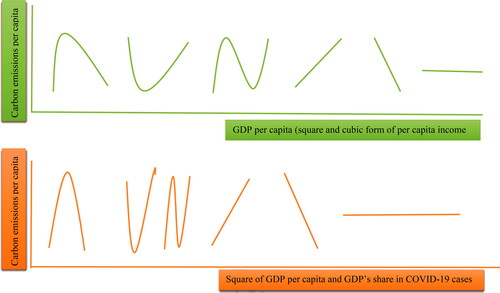
Figure 2. PH and PHH hypothesis.
Source: adapted from Cole (Citation2004) and Elliott et al., Citation2020).
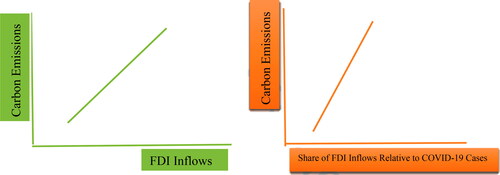
Figure 3. IPAT and PPP hypothesis.
Source: adapted from Nassani et al. (Citation2021) and authors self-extract.
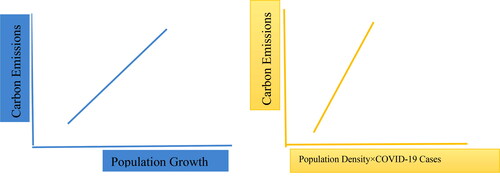
Table 1. Current literature on environmental sustainability during the COVID-19 pandemic.
Table 2. List of sample countries.
Table 3. Descriptive statistics.
Table 4. Markov switching regression (BFGS/Marquardt steps) estimates.
Table 5. VAR Granger causality estimates.
Table 6. VDA estimates of carbon damages.
Data availability statement
The data is freely available at Worldometer (Citation2021) at https://www.worldometers.info/coronavirus and World Development Indicators published by World Bank (Citation2021) at https://databank.worldbank.org/source/world-development-indicators