
Figures & data
Table 1. Descriptive statistics.
Figure 1. Chinese outward FDI flows from 2006 to 2017.
Source: Authors’ plot based on the data from the Ministry of Commerce of the Peoples’ Republic of China.
Notes: Year is presented in the horizontal axis and the volume of Chines OFDI in the unit of hundred million USD is presented in the vertical axis. The exact numbers are not reported due to limited space in the figure but are available upon requests.
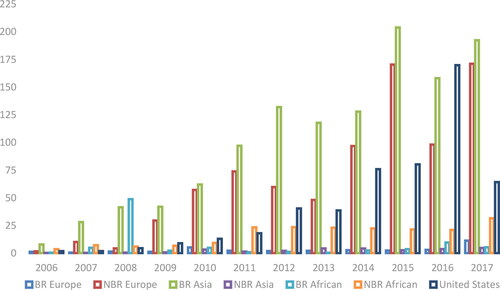
Figure 2. Number of Chinese cities twinning with their sister cities globally in 2006, 2013 and 2017.
Source: Authors’ plot based on the data from the Ministry of Foreign Affairs of the Peoples’ Republic of China by ArcGIS 10.2.
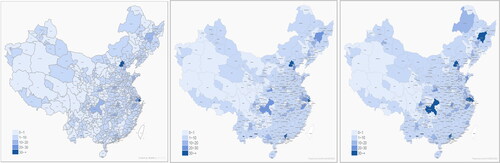
Figure 3. Number of sister-city relationships with China in 2017.
Source: Authors’ calculation based on the data from the Ministry of Foreign Affairs of the Peoples’ Republic of China by ArcGIS 10.2.
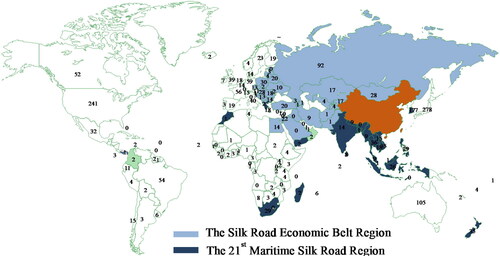
Table 2. PPML estimation for Chinese outward FDI and sister-city partnership.
Table 3. PPML estimations for Chinese firms’ CMA accomplishment and sister-city partnership.
Table 4. PPML estimations for Chinese firms’ CMA announcement and sister-city partnership.
Table 5. PPML estimations for the interaction between sister-city partnership and BRI on outward FDI and CMA.
Table 6. PPML estimations for the effect of sister-city partnership according to different tiers of Chinese cities.