Figures & data
Table 1. Definitions of the key variables.
Table 2. Descriptive statistics.
Table 3. Baseline regression models: market reaction to firms’ first acquisitions (regardless of whether the first acquisition is foreign or domestic).
Figure 1. Frequency distributions of cumulative abnormal returns contingent on whether acquisition is the first on record for a given company.
The charts represent frequency distributions of CAR td estimated on the even window of [–1;t] days where t varies from 1 to 30 days. Univariate t-test and Wilcoxon rank-sum (Mann–Whitney) test results for respective CARs are reported in .
Source: own elaboration.
![Figure 1. Frequency distributions of cumulative abnormal returns contingent on whether acquisition is the first on record for a given company.The charts represent frequency distributions of CAR td estimated on the even window of [–1;t] days where t varies from 1 to 30 days. Univariate t-test and Wilcoxon rank-sum (Mann–Whitney) test results for respective CARs are reported in Table 5.Source: own elaboration.](/cms/asset/aa76a0df-345e-4301-a1b7-3eceaa788eba/rero_a_1997621_f0001_c.jpg)
Table 4. Market reaction upon completion of the firms’ first and subsequent foreign/domestic acquisitions.
Table 5. Univariate tests for the difference in distributions of CARs [–1;t] for subsamples of first and subsequent acquisitions for a given acquirer.
Table 6. Market reaction following deal completion contingent upon acquirers’ prior acquisition experience.
Figure 2. Mean (subplot A) and median (subplot B) CARs for the first/second/third/fourth/fifth acquisitions for a given acquirer.
The charts represent mean (subplot A) and median (subplot B) CARs td estimated on the even window of [–1;t] days where t varies from 1 to 30 days. Univariate tests for differences in mean and median CARs are reported in .
Source: own elaboration.
![Figure 2. Mean (subplot A) and median (subplot B) CARs for the first/second/third/fourth/fifth acquisitions for a given acquirer.The charts represent mean (subplot A) and median (subplot B) CARs td estimated on the even window of [–1;t] days where t varies from 1 to 30 days. Univariate tests for differences in mean and median CARs are reported in Table 7.Source: own elaboration.](/cms/asset/646ee265-e459-40d1-b4b5-d7359d1d78c3/rero_a_1997621_f0002_c.jpg)
Table 7. Univariate tests for the difference in mean CARs [–1;t] for subsamples of fist/second/third/fourth/fifth acquisitions for a given acquirer.
Figure 3. Kernel density estimation plots of cumulative abnormal acquirer returns following the first foreign and first domestic acquisition.
The charts represent kernel density estimate plots of CAR td bootstrapped on the even window of [–1;t] days where t varies from 1 to 30 days.
Source: own elaboration.
![Figure 3. Kernel density estimation plots of cumulative abnormal acquirer returns following the first foreign and first domestic acquisition.The charts represent kernel density estimate plots of CAR td bootstrapped on the even window of [–1;t] days where t varies from 1 to 30 days.Source: own elaboration.](/cms/asset/6b4beae0-3266-4770-b6ea-bb5c2351108b/rero_a_1997621_f0003_c.jpg)
Table 8. Market reaction following firms’ first foreign/domestic acquisitions.
Figure 4. Geographical distribution of cross-border acquisitions completed by listed Chinese acquirers during 1996–2020.
Source: own elaboration.
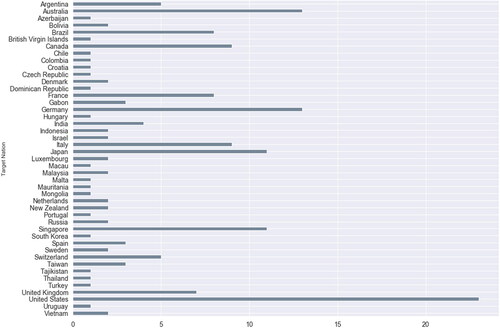
Table 9. Market reaction to horizontal and conglomerate acquisitions depending on acquirers’ prior acquisition experience.
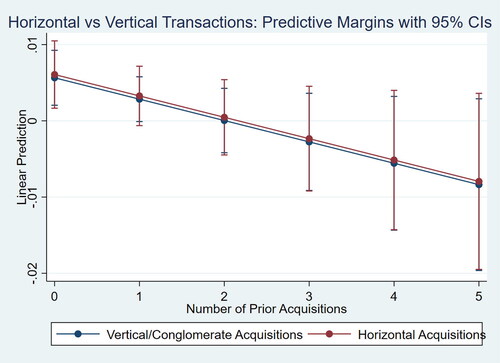
Figure 5. Marginal effect of acquirers’ prior acquisition experience on post-acquisition (CAR 3d) cumulative abnormal returns with 95% confidence interval.
The chart represents marginal effect of acquirers’ prior acquisition experience (measured as a number of acquisition completed prior to the analysed transaction by the same acquirer). Marginal effects are derived from partial cross-sectional regression coefficients reported in .
Source: own elaboration.