
Figures & data
Table 1. Confusion matrix (Source: Siddiqi, Citation2017).
Table 2. Cost functions used in the assessment (Source: authors’ computation).
Figure 1. Evolution of interest rate for mortgage loans in RON and EUR (Source: National Bank of Romania).
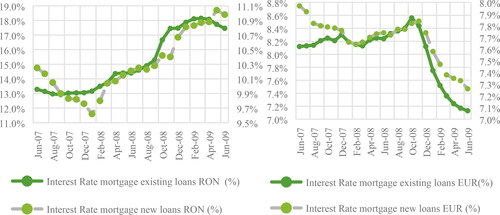
Table 3. Portfolio allocation based on interest rate regime (Source: authors’ computation).
Figure 2. The default profile in Regime I and Regime II (Source: authors’ computation).
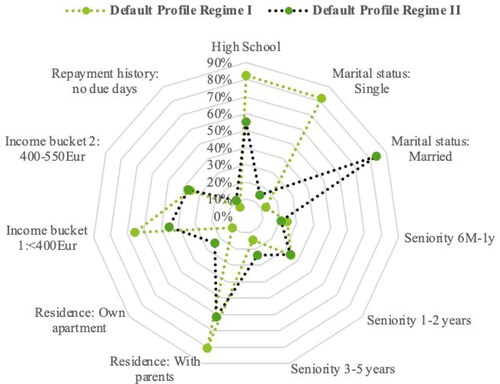
Figure 3. Minimum classification error in Regime I (Source: authors’ computation).
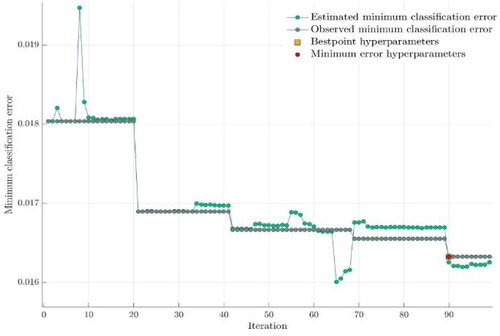
Table 4. Champion model results in Regime I (Source: authors’ computation).
Figure 4. Sensitivity and specificity in Regime I (Source: authors’ computation).
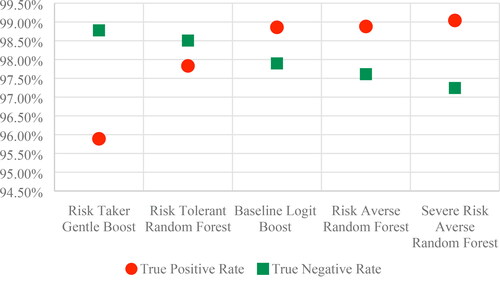
Table 5. Champion model results in Regime II (Source: authors’ computation).
Figure 5. Sensitivity and specificity in Regime II (Source: authors’ computation).
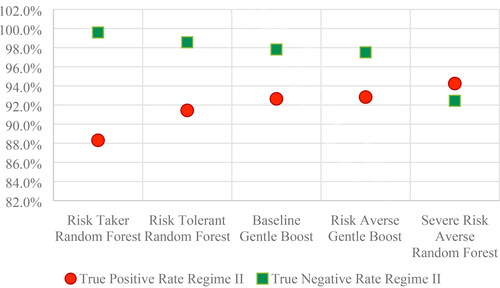
Figure 6. True positive and true negative rate across scenarios for both regimes (Source: authors’ computation).
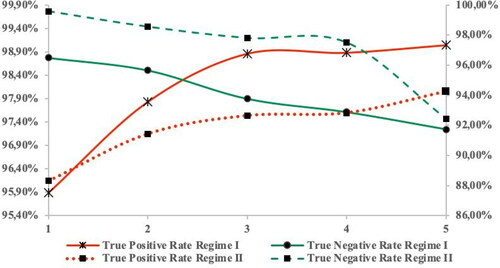
Table 6. Random Forest across scenarios for both regimes (Source: authors’ computation).
Figure 7. Sensitivity and specificity in Portfolio (Source: authors’ computation).
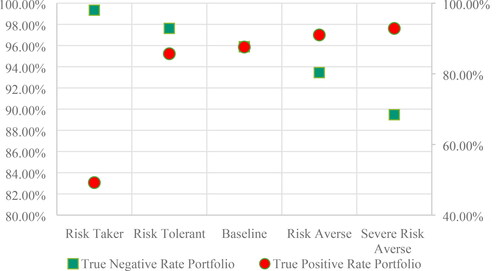
Table 7. Accuracy and loss function (Source: authors’ computation).