
Figures & data
Table 1. Description of variables considered in the model.
Figure 1. Evolution in time on the endogenous variables.
Source: Authors’ projection
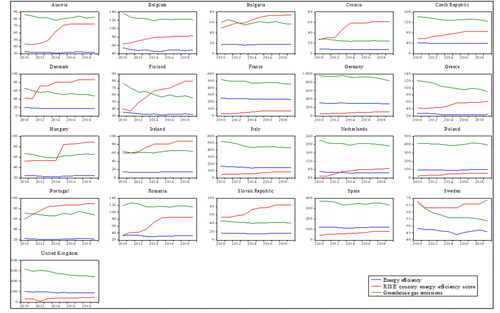
Figure 2. Country profile based on average of endogenous variables.
Source: Authors’ projection
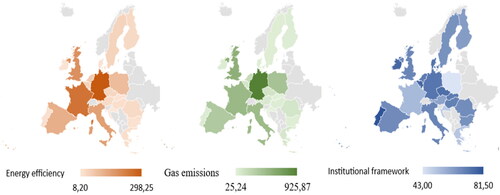
Table 2. Descriptive statistics.
Table 3. Correlation matrix.
Table 4. Panel unit root test results.
Table 5. Granger causality analysis.
Table 6. Lag length selection results.
Table 7. VAR Model estimation.
Figure 3. Representation of shock effects on model endogenous variables.
Source: Authors’ projection
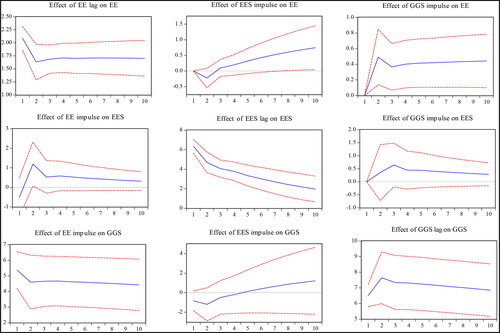
Figure 4. Representation of endogenous variables to a variation on energy efficiency.
Source: Authors’ projection
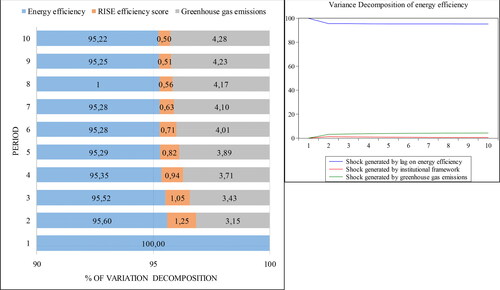
Table 8. Var model estimation considering exogenous variables.