
Figures & data
Table 1. Represents the classification of research variables.
Figure 1. Moran scatter plot of all provinces of China.
Source: The authors.
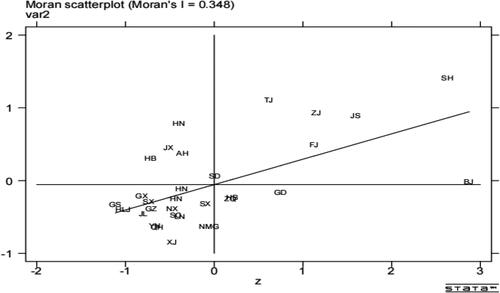
Table 2. Represents Moran’s index.
Table 3. Spill-over effect decomposition of SDM.
Table 4. Shows the regression results of the applied models.
Table 5. Regression results of effects of the Spatial Dubin model.
Table 6. Show the results of additional inspections early stage.
Table 7. Shows the effects of GDP growth stage.
Table 8. Shows the spatial correlation of maturity stage.
Table 9. Shows the results of declining stage.
Table 10. Chow test results of moderating effects of CSR & GDP*Lifecycle of FC.
Table 11. Robustness test by controlling additional variables and adopting two-step GMM methods.
Table 12. CSR and FC: Two-stage least square (2SLS) estimation.