
Figures & data
Figure 1. G-7 countries annual air transportation CO2 emission. Source: OECD. Stat Data set of Air transportation carbon emission.
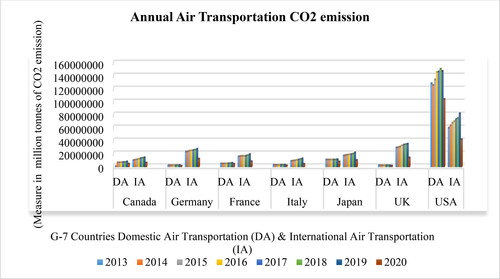
Figure 2. Annual exposure of fine particulate matter (PM2.5) of G-7 countries. Source: OECD. Stat Data set of exposure to Fine particulate matter (PM2.5) data aggregated from over 80,000 data points.
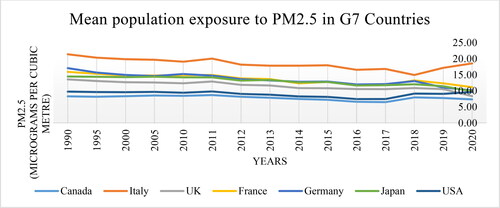
Table 1. Data description.
Table 2. Results of cross-sectional dependence analysis.
Table 3. Results of unit root test with & without structural break Pesaran (Citation2007).
Table 4. Results of slope heterogeneity analysis.
Table 5. Results of Westerlund and Edgerton (Citation2008) panel cointegration analysis.
Table 6. Results of Banerjee and Carrion‐i-Silvestre (Citation2017) cointegration analysis.
Table 7. Results of CS-ARDL analysis (Long run CS-ARDL results).
Table 8. Results of CS-ARDL analysis (short run CS-ARDL results).
Table 9. Results of AMG & CCEMG for robustness check.