
Figures & data
Figure 1. Spatial distribution of the Yangtze River Delta urban agglomeration.
Source: Made by author.
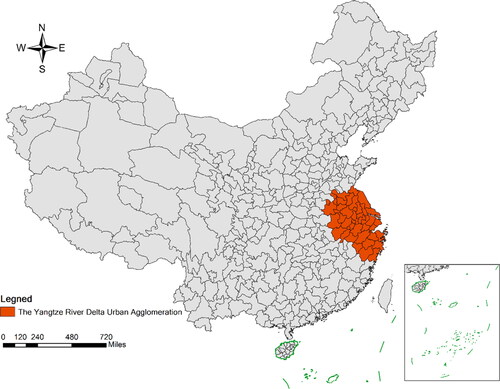
Table 1. Spatial Gini coefficient of modern service industry in Yangtze River Delta city group.
Figure 2. Spatial distribution of modern service workers in the Yangtze River Delta urban agglomeration (2008, 2012, 2016, 2018).
Source: Made by author.
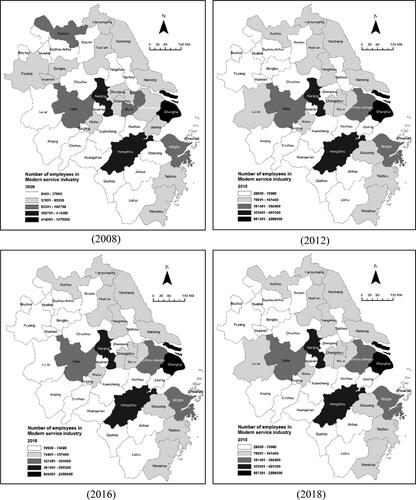
Figure 3. Spatial agglomeration and diffusion of modern service industries.
Source: Made by author.
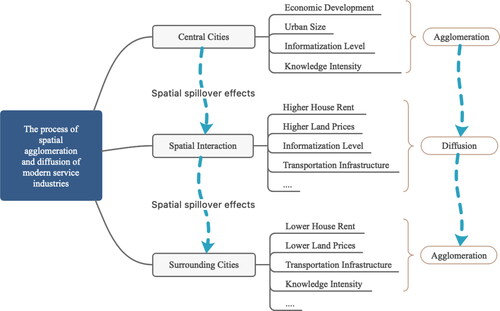
Table 2. Results of Lagrange multiplier test.
Table 3. Result of Hausman test for spatial lag model.
Table 4. Result of spatial lag model estimation of random effects.
Table 5. Result of random effects decomposition of spatial lag model.
Table 6. Result of robustness test.