
Figures & data
Figure 1. Digital Financial Inclusion Index and city’s export sophistication in 2013 (left) and 2017 (right).
Source: The Authors.
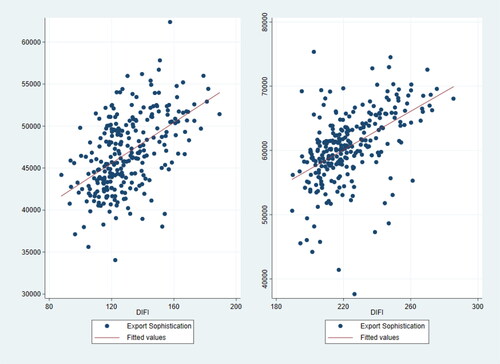
Figure 2. Traditional finance development and city’s export sophistication in 2013 (left) and 2017 (right).
Source: The Authors.
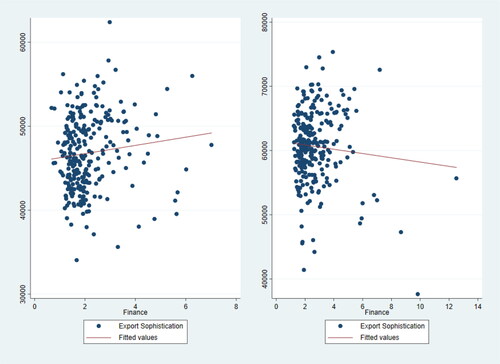
Table 1. Descriptive statistics of main variables.
Table 2. Benchmark regression results.
Table 3. Estimation results of instrumental variables.
Table 4. Regression results of robustness test.
Table 5. Estimation results of city’s heterogeneity analysis.
Table 6. Mechanism results of innovation effect.
Table 7. Bootstrap sampling mechanism results of innovation effect ().
Table 8. Mechanism test of market effect.
Table 9. Bootstrap sampling mechanism results of market effect ().