
Figures & data
Figure 1. Relation between components of social cohesion in authors’ interpretation.
Source: Drawn by the author.
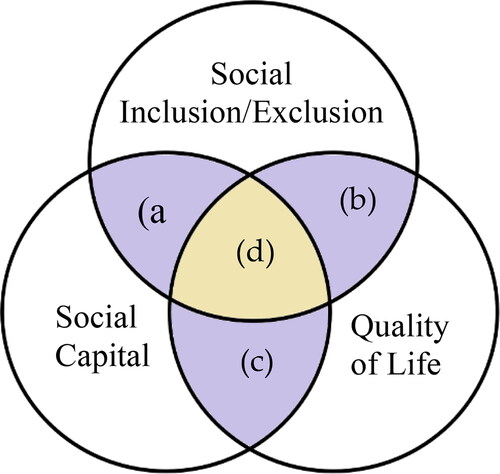
Table 1. Variable description.
Table 2. Data description.
Figure 2. Coefficients of migrant dummy by year. Note. the dots stand for OLS coefficients for migrant dummy by year. The lines represent the 95% confidence intervals surrounding the point estimation.
Source: China Migrants Dynamic Survey.
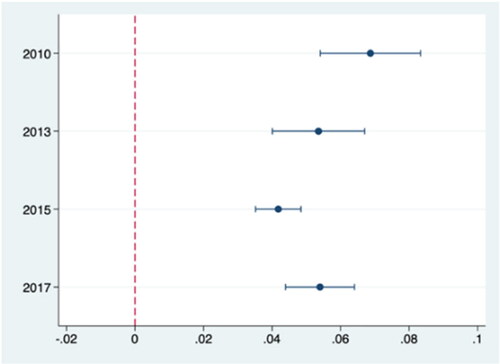
Table 3. OLS results of different saving behaviours between migrants and local hukou population in urban area.
Table 4. The importance of local public service and housing.
Table 5. The importance of local public service and housing with comparison between non-agricultural hukou migrants and local hukou population.
Table 6. Quantile regression results of 2013 sample.
Figure 3. Quantile coefficients for migrant dummy. Note. the line stands for quantile coefficient for migrant dummy while the dashed line stands for OLS coefficient for migrant dummy. The dot represents the 95% confidence intervals surrounding them.
Source: China Migrants Dynamic Survey.
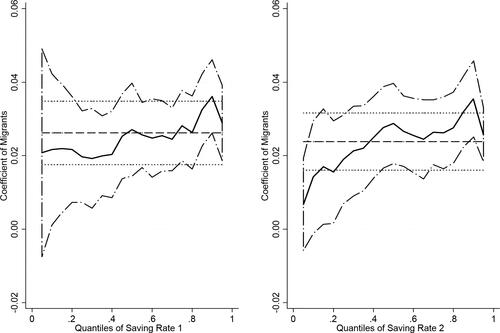
Table 7. OLS regression results of remittance for consumption motive.