
Figures & data
Figure 1. Conceptual framework. Note: The scale of credit provided by banks is relevant to economic performance, but this is beyond the scope of this study and are thus excluded. Arrows indicate the destination of the influence. Source: Prepared by the author.
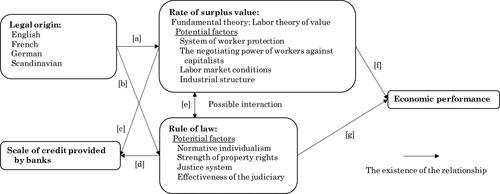
Table 1. Target countries and legal origins.
Table 2. Definitions of variables.
Table 3. Descriptive statistics.
Table 4. Unit root tests of the main variables.
Figure 2. Relationship between GDP/Capita and rate of surplus value and between GDP/Capita and rule of law. Note: GDP/Capita is the natural logarithm. For the classification of legal origins, refer to La Porta et al. (Citation2008). The figure uses the arithmetic mean from 2004 to 2017 for each country. The number of observations was 82. Source: Compiled by the author.
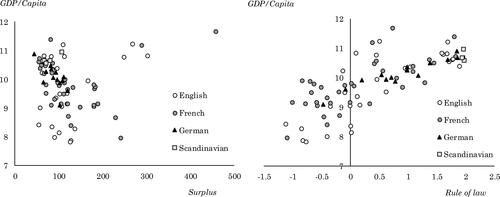
Table 5. Estimation results (EquationEq. (1)(1)
(1) ).
Table 6. Estimation results (EquationEq. (2)(2)
(2) ).
Figure 3. Relationship between rule of law and rate of surplus value. Note: The rate of surplus value is the natural logarithm. The estimation uses the least squares method, and the figure uses the arithmetic mean from 2004 to 2017 for each country. The number of observations was 82. Source: Compiled by the author.
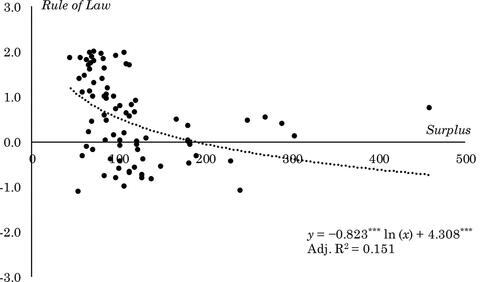
Table 7. Estimation results (EquationEq. (3)(3)
(3) ).
Table 8. Marginal effects of the interaction term on GDP/Capita (Surplus).
Table 9. Marginal effects of the interaction term on GDP/Capita (Rule of law).
Table 10. GMM Model with the sample separated by legal origin.
Data availability
This study uses publicly available data from the OECD, ILO, World Bank, and IMF.