
Figures & data
Figure 1. Average number of employees in the field of transport and logistics in the period 2015–2019; Source: ČSÚ (Citation2020).
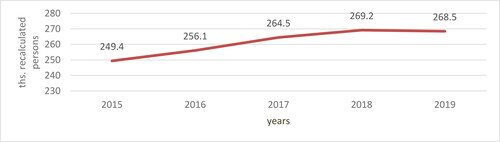
Figure 2. Development of preferences in the period 2017/2019 according to (the groups of) motivational factors.
Source: own research.
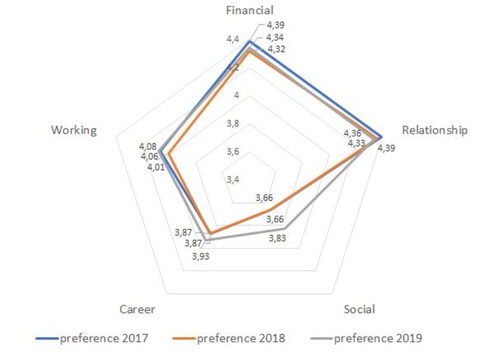
Figure 3. Development of satisfaction in the period 2017–2019 according to (the groups of) motivational factors.
Source: own research.
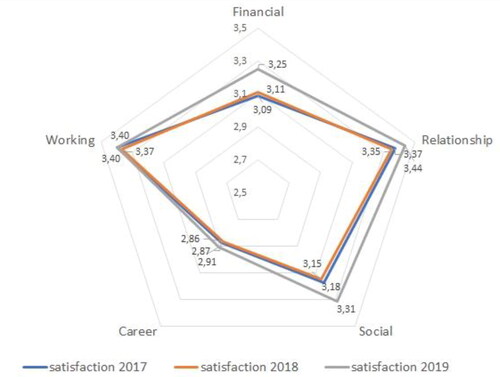
Table 1. ANOVA test of preferences according to (the groups of) motivational factors for the period 2017–2019.
Table 2. Tukey’s HSD test of preferences according to (the groups of) motivational factors for the period 2017–2019.
Table 3. ANOVA test of preferences according to selected motivational factors for the period 2017–2019.
Table 4. Tukey’s HSD test of preferences according to selected motivational factors for the period 2017–2019.