Figures & data
Figure 1. The trend chart of the full-sample logarithmic return rate of bank index, securities index, fund index and insurance index. The upper left corner, upper right corner, lower left corner and lower right corner are the corresponding bank index, securities index, fund index and insurance index, respectively.
Source: Authors.
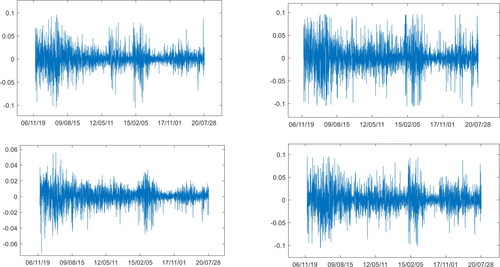
Figure 2. Autocorrelation and partial autocorrelation analysis chart of the return series of bank index, securities index, fund index and insurance index. The upper left corner, upper right corner, lower left corner and lower right corner are the corresponding bank index, securities index, fund index and insurance index, respectively.
Source: Authors.
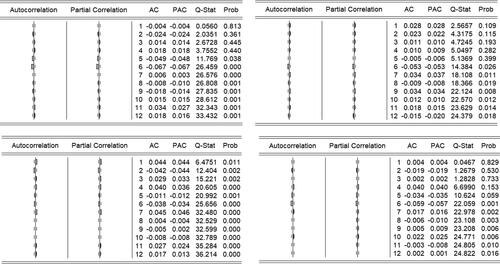
Table 1. Descriptive statistical analysis of the series of returns of financial institutions.
Table 2. ARCH-LM test of index yield series of each financial institutions.
Figure 3. Autocorrelation and partial autocorrelation analysis chart of yield series of bank index, securities index, fund index and insurance index. The upper left corner, upper right corner, lower left corner and lower right corner are the corresponding bank index, securities index, fund index and insurance index, respectively.
Source: Authors.
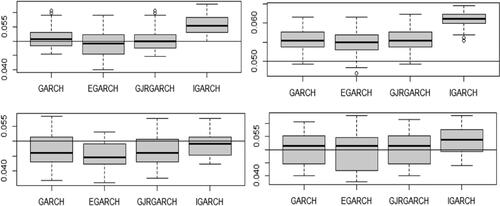
Table 3. The fitting value of GRACH models for the yield of different financial institution indexes.
Table 4. The test results of the residual series of each index.
Figure 4. VMD decomposition results of the bank index yield. The upper left corner, upper right corner, lower left corner and lower right corner are corresponding original wave sequence, VMD1, VMD5 and VMD10, respectively.
Source: Authors.
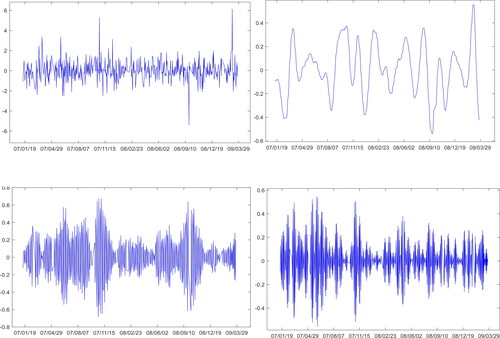
Figure 5. VMD decomposition results of the securities index yield. The upper left corner, upper right corner, lower left corner and lower right corner are corresponding original wave sequence, VMD1, VMD5 and VMD10, respectively.
Source: Authors.
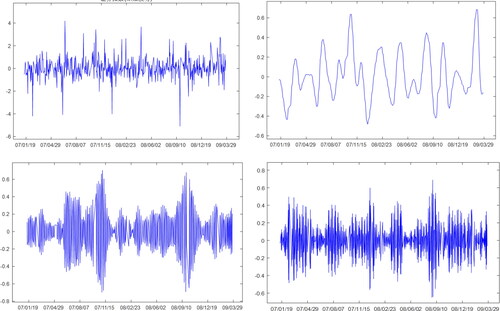
Figure 6. VMD decomposition results of the fund index yield. The upper left corner, upper right corner, lower left corner and lower right corner are corresponding original wave sequence, VMD1, VMD5 and VMD10, respectively.
Source: Authors.
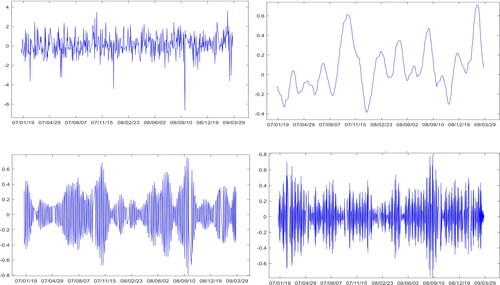
Figure 7. VMD decomposition results of the insurance index yield. The upper left corner, upper right corner, lower left corner and lower right corner are corresponding original wave sequence, VMD1, VMD5 and VMD10, respectively.
Source: Authors.
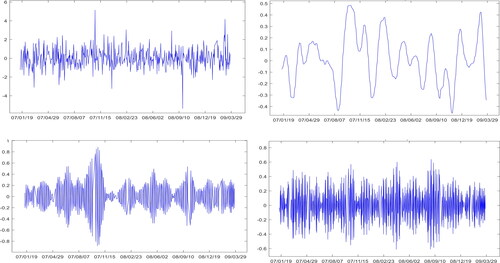
Table 5. Copula selection results at different frequencies.
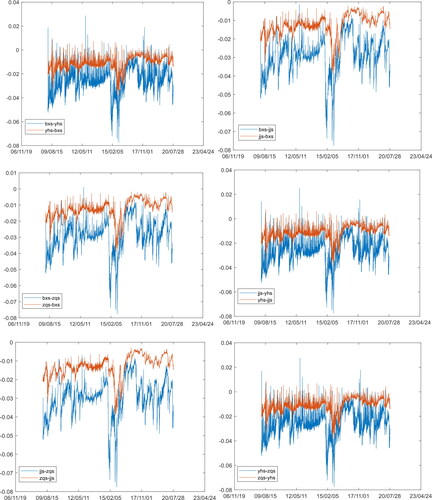
Figure 8. The long-term risk spillover effect between financial institutions under the dynamic CoVaR model. ‘yh’ stands for bank, ‘jj’ stands for fund, ‘zq’ stands for securities, ‘bx’ stands for insurance, and ‘l’ stands for long-term. For example, ‘jjl-zql’ stands for long-term risk contagion between fund index and securities index, and so on.
Source: Authors.
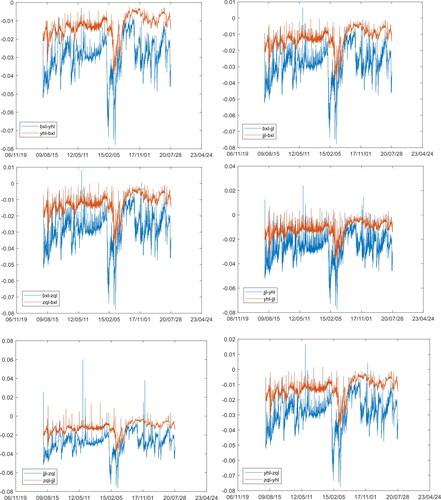
Figure 9. The medium-term risk spillover effect between financial institutions under the dynamic CoVaR model. ‘yh’ stands for bank, ‘jj’ stands for fund, ‘zq’ stands for securities, ‘bx’ stands for insurance, and ‘m’ stands for medium-term. For example, ‘jjm-zqm’ stands for medium-term risk contagion between fund index and securities index, and so on.
Source: Authors.
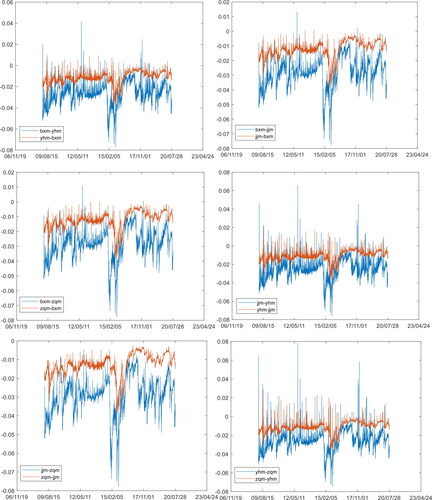
Figure 10. The short-term risk spillover effect between financial institutions under the dynamic CoVaR model. ‘yh’ stands for bank, ‘jj’ stands for fund, ‘zq’ stands for securities, ‘bx’ stands for insurance, and ‘s’ stands for short-term. For example, ‘jjs-zqs’ stands for short-term risk contagion between fund index and securities index, and so on.
Source: Authors.