
Figures & data
Figure 1. The performance of the FTB property markets.
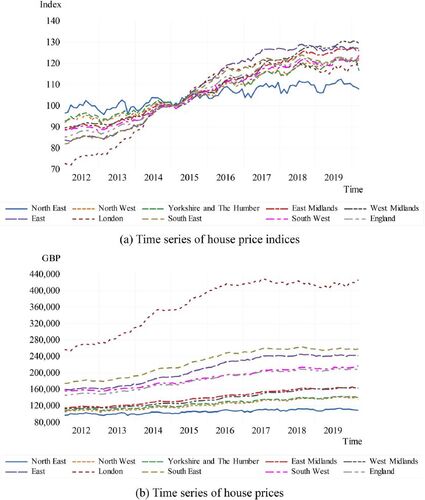
Figure 2. The performance of the FOO property markets.
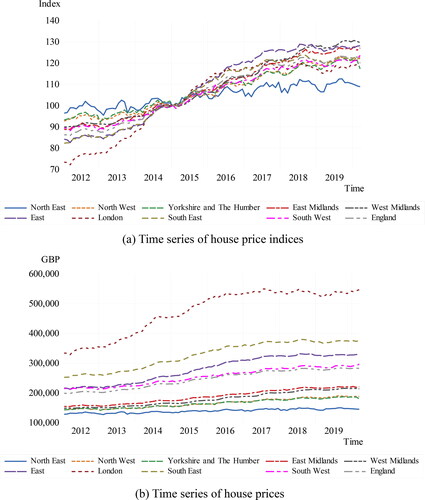
Table 1. Causality tests between the FTB and FOO markets.
Table 2. The VAR-MGARCH-X model.
Figure 3. Time series of macroeconomic variables.
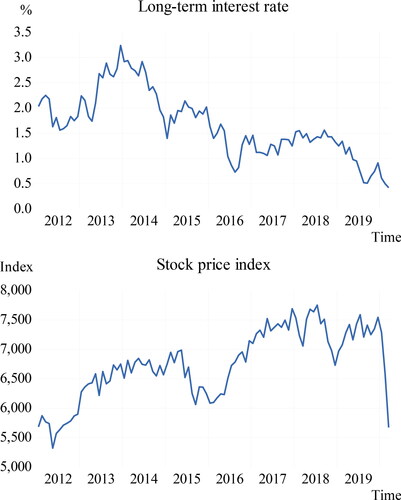
Table 3. Causality tests in mean and in variance.
Figure 4. Conditional volatilities.
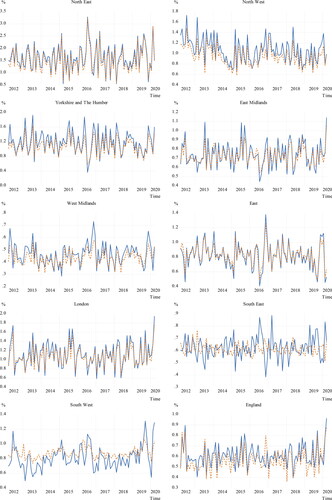
Table 4. Factor risk.
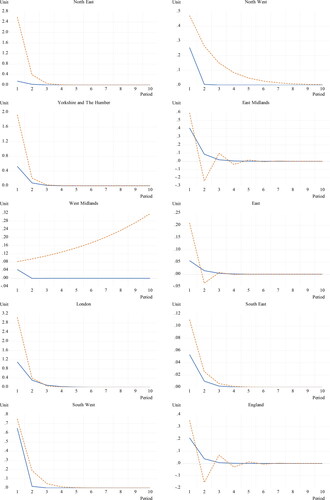
Figure 5. Impulse response function of volatilities.
Table
Appendix Table A1. Descriptive statistics and unit root tests (FTB properties).
Appendix Table A2. Descriptive statistics and unit root tests (FOO properties).
Appendix Table A3. Descriptive statistics and unit root tests for the two factors.