
Figures & data
Table 1. Some mathematical notations used in this study.
Figure 1. The conflict analyses in the ORESTE method.
Source: from Liao et al. (Citation2018a).
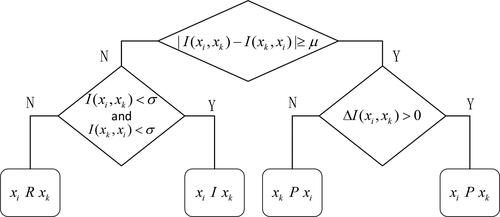
Table 2. Comparison of fusing methods.
Figure 2. An illustrative example of a partial ranking.
Source: created by the authors.
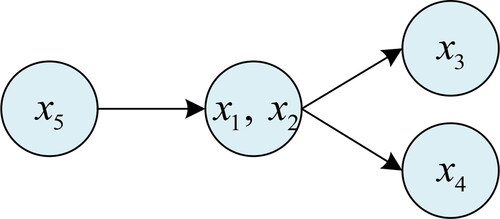
Table 3. Implicit binary relations in the illustrative partial ranking.
Figure 3. A consensus measurement process in terms of two hierarches.
Source: created by the authors.
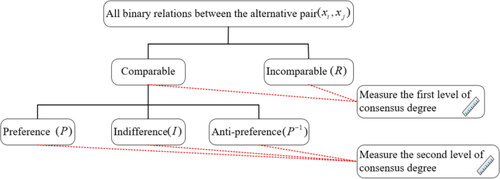
Table 4. The frequency distribution of the relation types between in the first level.
Table 5. The frequency distribution of the relation types between in the second level.
Figure 4. The train of thinking to set the consensus threshold.
Source: created by the authors.
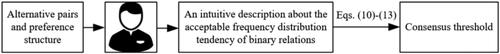
Table 6. The collective preference scores.
Table 7. The frequency distribution of the relation types between in the first level.
Table 8. The frequency distribution of the relation types between in the second level.
Table 9. The ordinal consensus degrees for
Table 10. The consensus thresholds for
Figure 5. The frequency variations of binary relations in
(a) The first hierarchy (b) The second hierarchy
Source: created by the authors.
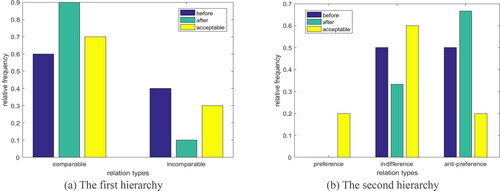
Figure 6. The average preference intensities between and
Source: created by the authors.
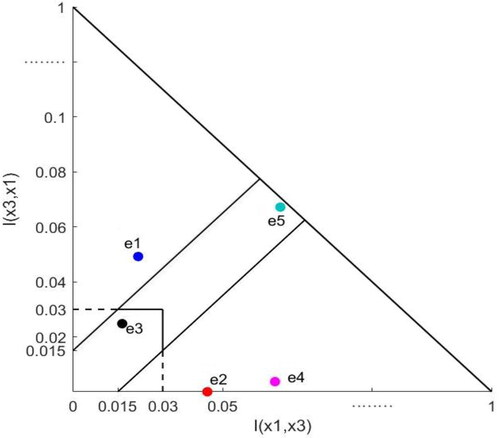
Figure 7. The schematic of conflict analysis.
Source: from Liao et al. (Citation2018a).
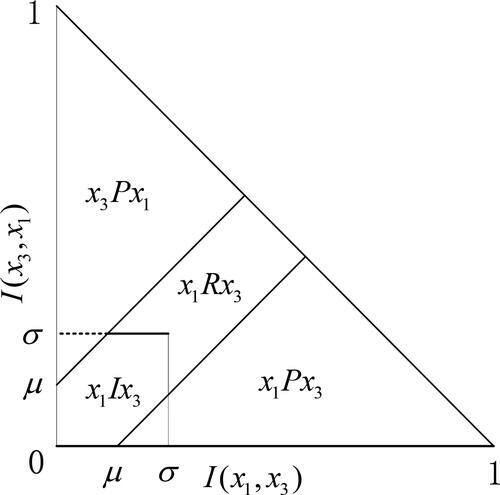
Figure 8. The distances between binary relations.
Source: from Jabeur et al. (Citation2004).
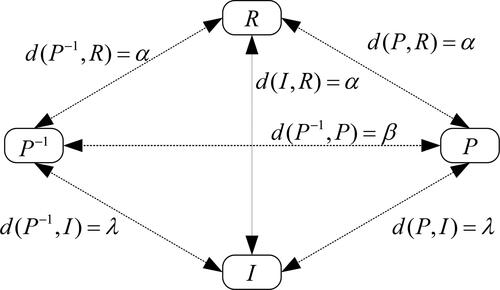
Table A1. The global preference scores derived from the evaluations of
Table A2. The average preference intensities derived from the evaluations of
Table A3. The global preference scores derived from the evaluations of
Table A4. The average preference intensities derived from the evaluations of
Table A5. The global preference scores derived from the evaluations of
Table A6. The average preference intensities derived from the evaluations of
Table A7. The global preference scores derived from the evaluations of
Table A8. The average preference intensities derived from the evaluations of
Table A9. The global preference scores derived from the evaluations of
Table A10. The average preference intensities derived from the evaluations of