Figures & data
Table 1. Summary statistics, December2008-December2014 (monthly data, base period December 2008 = 100).
Figure 1. Consumer price index, cumulative from December 2008-December 2014.
Note: CPISI – consumer price index in Slovenia, CPIMNE – consumer price index in Montenegro, and IPHIEA – consumer price index in euro area (monthly data, base period December 2008 = 100).
Source: Authors’ calculations based on data from (SORS Citation2021) and MONSTAT (Citation2020).
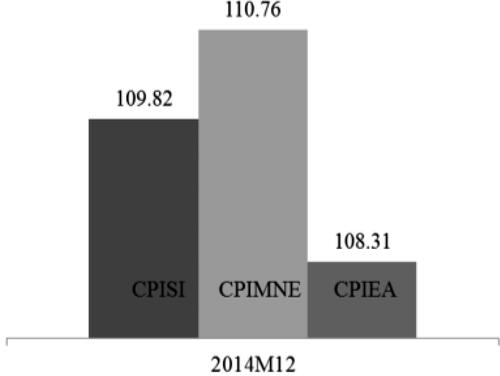
Table 2. VEC model analysis, unit root test and cointegration test, December 2008–December 2014 (monthly data, base period December 2008 = 100).
Figure 2. Dynamics of tourism prices, December 2008-December 2014.
Note: IPHIMNE – Montenegrin price index in the hospitality industry, IPHISI – Slovenian price index in the hospitality industry, and IPHIEA – euro area price index in the hospitality industry (monthly data, base period December 2008 = 100).
Source: Authors’ calculations based on data from (SORS Citation2021) and MONSTAT (Citation2020).
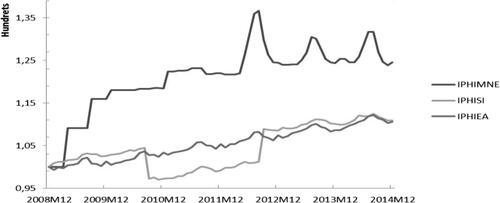
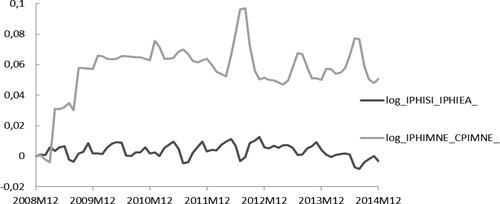
Figure 3. Dynamics of tourism prices in logarithms (in the first differences), December 2008-December 2014.
Note: log IPHIMNE_CPIMNE – real (second-order integration) Montenegrin price index in the hospitality industry captured first, by logarithms, and second, Montenegrin price index in the hospitality industry divided by Montenegrin consumer price index (base period December 2008 = 100).
Source: Authors’ calculations based on data from (SORS Citation2021) and MONSTAT (Citation2020).