
Figures & data
Table 2. Descriptive statistics of variable.
Figure 1. Regression discontinuity estimation.
Source: Authors.
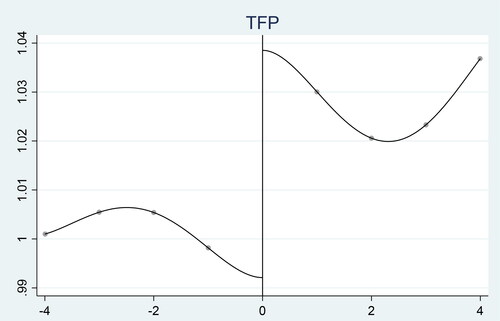
Table 3. Sharp RD estimation using local polynomial.
Table 4. RDSR mediating effect test results.
Figure 2. Discontinuity effect of control variable.
Source: Authors.
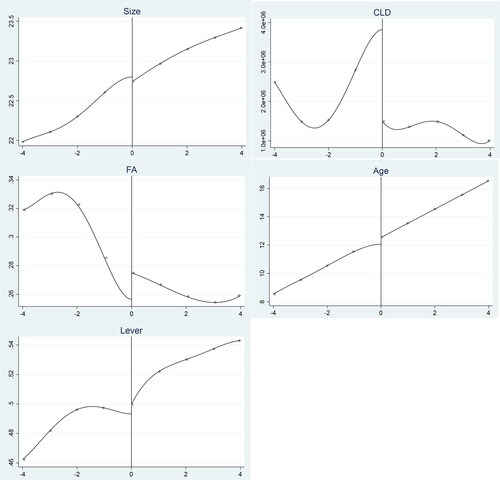
Table 5. Discontinuity effect of the control variables.
Table 6. Test results after changing the discontinuity years.
Table 7. Test results of different bandwidths.
Table 8. Industry classification results.
Table 9. Industry heterogeneity analysis.
Table 10. Equity rights heterogeneity analysis.
Table 1. Input-output indicators of TFP measurement.