
Figures & data
Table 1. Variable definitions.
Table 2. Distribution of 22725 samples and CSR from 2010 to 2020.
Figure 1. Line chart of the average score of CSR in 2010–2020.
Source: Authors compilation.
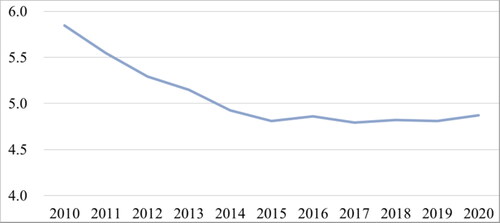
Table 3. Descriptive statistics.
Table 4. Parent-subsidiary companies’ geographic distances and CSR.
Table 5. Parent-subsidiary companies’ geographic distances, property nature and CSR.
Table 6. Parent-subsidiary companies’ geographic distances, regional differences and CSR.
Table 7. Test results of intermediary effect.
Table 8. Robustness test: delete four municipalities.