
Figures & data
Figure 1. Basic GNP structure.
Source: drawn by authors with the help of R software.
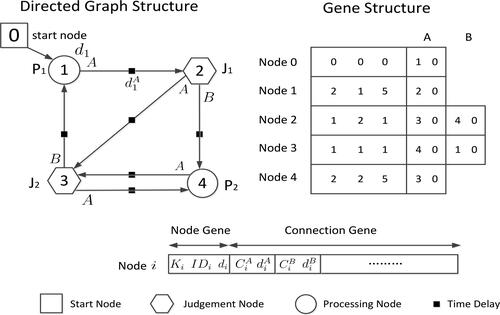
Figure 2. Inner structure of judgment and processing nodes.
Source: drawn by authors with the help of R software.
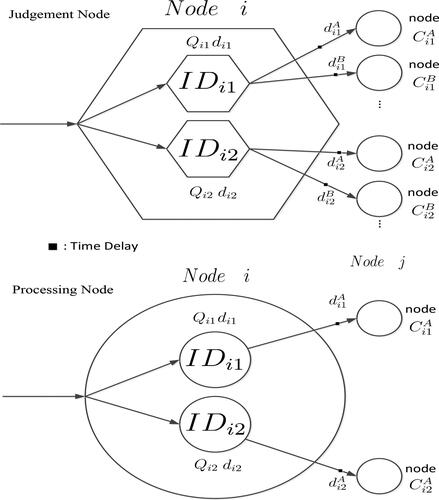
Figure 3. Illustration of the crossover operator.
Source: drawn by authors with the help of R software.
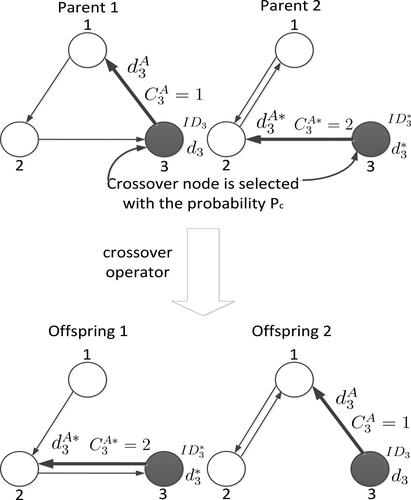
Figure 4. Illustration of the mutation operator.
Source: drawn by authors with the help of R software.
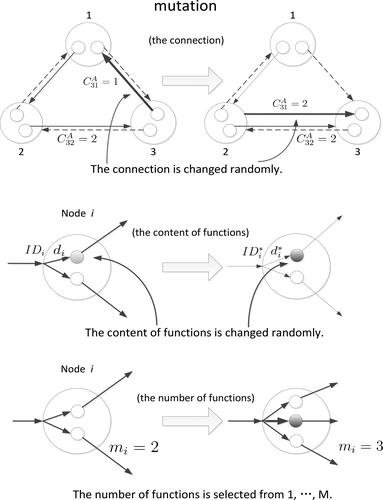
Figure 5. IMX function.
Source: drawn by authors with the help of R software.
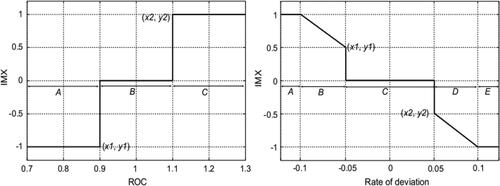
Figure 6. An example of node transition.
Source: drawn by authors with the help of R software.
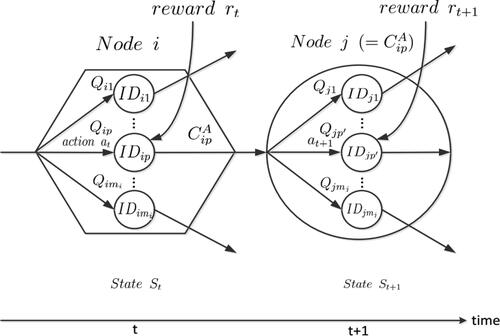
Table 1. Parameter settings.
Figure 7. The price time series of the four market types.
Source: drawn by authors with the help of R software.
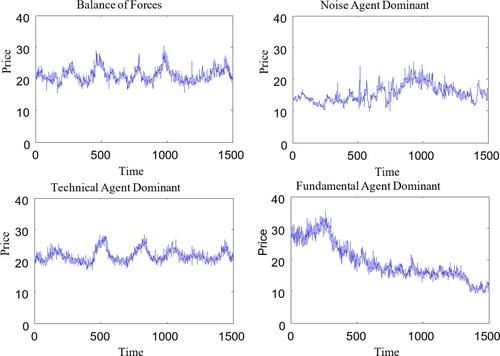
Figure 8. The return time series of the four market types.
Source: drawn by authors with the help of R software.
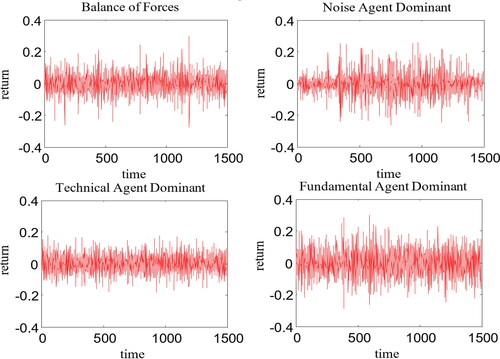
Table 2. Descriptive statistics of price for the four price time series.
Table 3. Descriptive statistics of return for the four price series.
Figure 9. Trends of prices and bonuses in the four markets.
Source: drawn by authors with the help of R software.
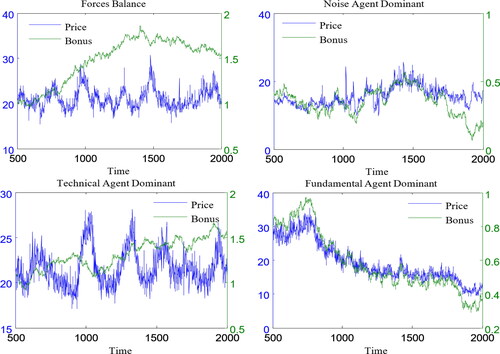
Table 4. Correlation between price and bonus trends.
Table 5. ANOVA analysis of excess volatility.
Table 6. The ANOVA Analysis Result of κ.