Figures & data
Table 1. Database and countries list.
Figure 1. China’s financial cycle and the long-run trend. Note: the blue line (FC) represents China’s financial cycle using the state space model and the Kalman filter method; the red line (FCT) plot China’s financial cycle long-run trend and is calculated by Hodrick-Prescott (H-P) filter with lambda = 100.
Source: The Authors.
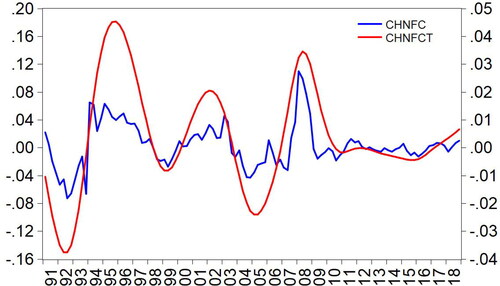
Table 2. Characteristics of China’s financial cycles.
Table 3. Unit Root Test – financial cycles of China and the G7 countries.
Figure 2. The static financial cycle spillover from China to the G7 countries.
Source: The Authors.
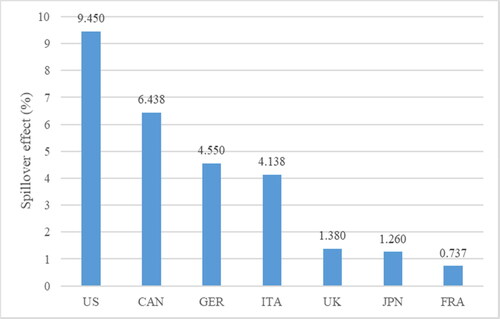
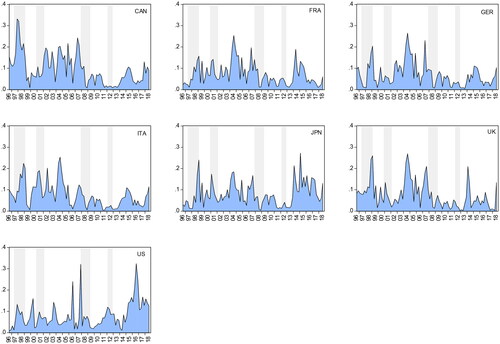
Figure 3. Financial cycle net spillovers from China to the G7 countries. Note: Shading denotes the financial crisis as defined by the NBER.
Source: The Authors.
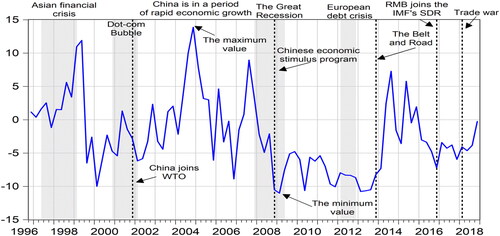
Figure 4. Financial cycle spillovers from China to each of the G7 countries.
Source: The Authors.