4,327
Views
28
CrossRef citations to date
0
Altmetric
Articles

Sustainable digital economy and trade adjusted carbon emissions: Evidence from China’s provincial data

, , , & ORCID Icon
Pages 5469-5485 | Received 08 Nov 2021, Accepted 06 Jan 2022, Published online: 09 Feb 2022

Figures & data

Figure 1. The theoretical framework.

Source: Author own derivations.

Figure 1. The theoretical framework.Source: Author own derivations.

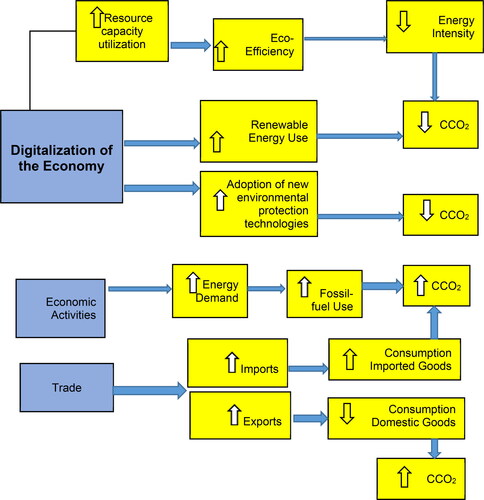
Table 1. Descriptive statistics.

Table 2. Diagnostic tests.

Table 3. Unit root test.

Table 4. Westerlund (Citation2007) ECM based cointegration.

Table 5. Method of moment quantile regression.

Table 6. Ratio of CBA/PBA.

Table 6. Dumitrescu Hurlin panel causality.