
Figures & data
Figure 1. Analysis diagram of the intermediary effect mechanism.
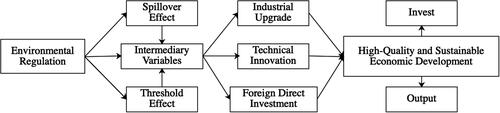
Table 1. Parameter design.
Table 2. Green total factor production measurement index.
Table 3. Regional green total factor productivity.
Table 4. characteristics of main variables.
Table 5. Moran index of high-quality economic development from 2004 to 2017.
Table 6. Calculation results of the spatial econometric model.
Table 7. Analysis of and its index decomposition results.
Table 8. Analysis of the influence mechanism of the mediating effect.
Table 9. Analysis of the results of the subregional mediating effect mechanism.
Table 10. Robustness test.
Table 11. threshold effect test results.
Table 12. Threshold regression results.