Figures & data
Figure 1. Contribution of tourism to service exports, selected OECD countries, 2018.
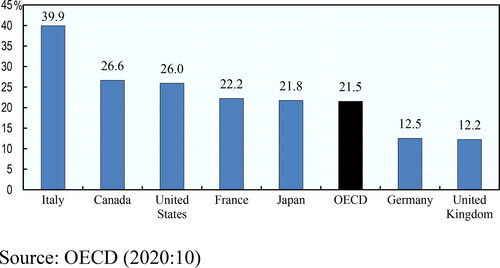
Table 1. Variables definition.
Table 2. Descriptive statistics.
Table 3. Correlations and CD test results.
Table 4. Panel unit root test results.
Table 5. Lag length selection.
Table 6. Granger causality test results.
Figure 2. Impulse-responses analysis results. Note: The results show cumulative responses. Shaded areas are 95% confidence interval. Monte Carlo simulation with 1000 draws is used to obtain a confidence interval.
Source: Authors.
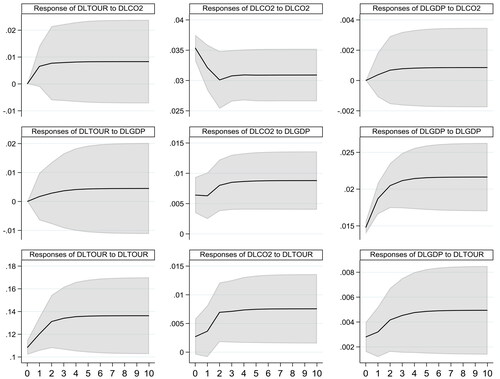
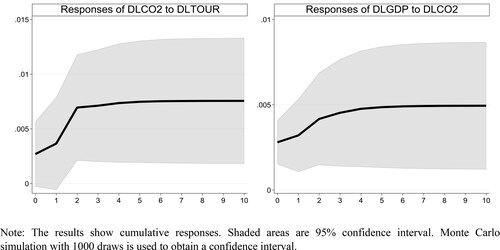
Figure 3. The responses of carbon emissions and GDP to a tourism shock.
Source: Authors.