
Figures & data
Figure 1. Structures of GNP individual and GNP node.
Source: drawn by authors with the help of R software.
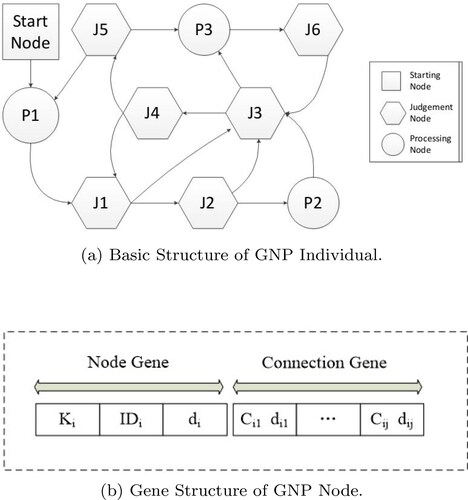
Table 1. Price return of transaction.
Table 2. Database after transformation.
Table 3. Example of the weight database of a transaction.
Figure 2. Judgment node chains.
Source: drawn by authors with the help of R software.
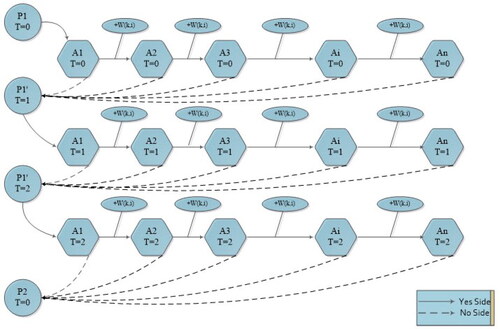
Figure 3. Rule extraction of the proposed method.
Source: drawn by authors with the help of R software.
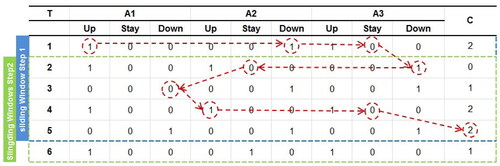
Table 4. Parameters of the class association rule mining method.
Table 5. Six kinds of classifiers.
Table 6. Average profits for 30 stocks of the 6 classifier models (%).
Table 7. Max profits for 30 stocks of the 6 classifier models (%).
Figure 4. Profit fluctuation for exxon mobil corp.
Source: drawn by authors with the help of R software.
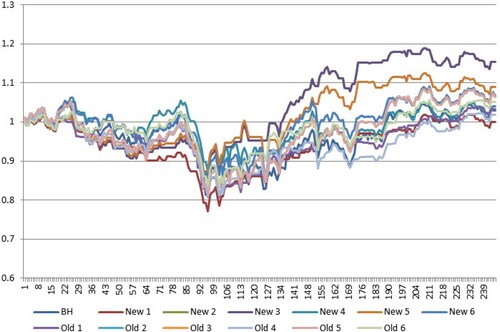
Figure 5. Profit fluctuation for J.P. Morgan Chase & Co.
Source: drawn by authors with the help of R software.
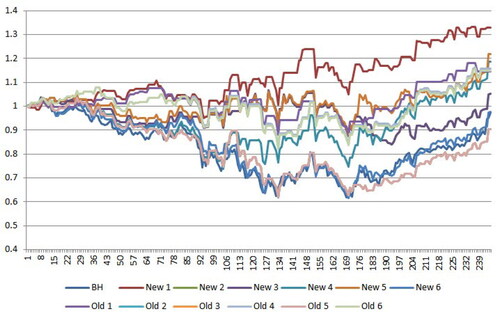
Figure 6. Profit fluctuation for Coca-Cola Company.
Source: drawn by authors with the help of R software.
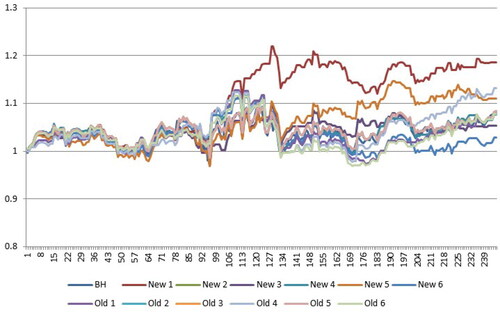
Table 8. Accuracy of prediction.