Figures & data
Table 1. Basic characteristics of policy text.
Figure 1. Flow chart of research design.
Source: drawn by the authors based on NVivo.11 software.
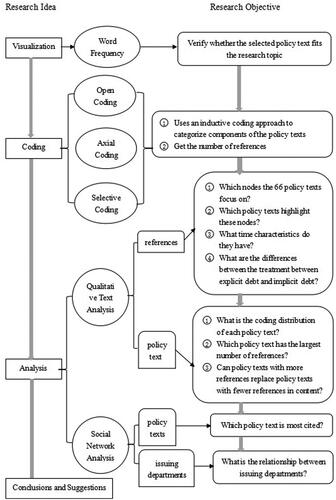
Figure 2. Word cloud.
Source: drawn by the authors based on NVivo.11 software.
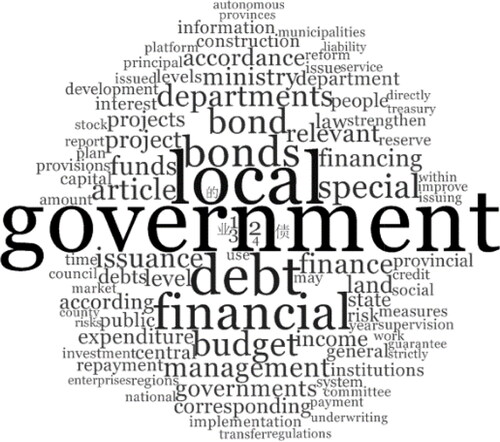
Table 2. The formation of tree node, reference and source.
Table 3. Percentage agreement.Table Footnotea
Figure 3. The temporal characteristics of child nodes of ‘management measure’ and ‘market mechanism’ based on the number of references.
Source: drawn by the authors based on NVivo.11 software.
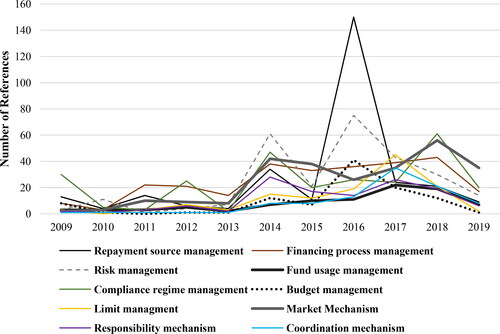
Figure 4. Repayment source management.
Source: drawn by the authors based on NVivo.11 software.
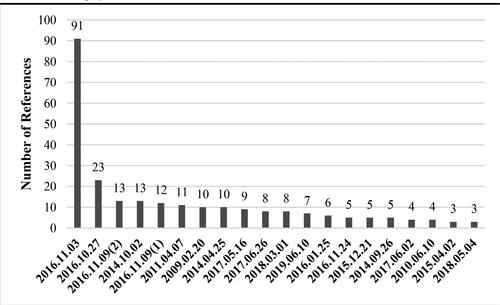
Figure 5. Financing process management.
Source: drawn by the authors based on NVivo.11 software.
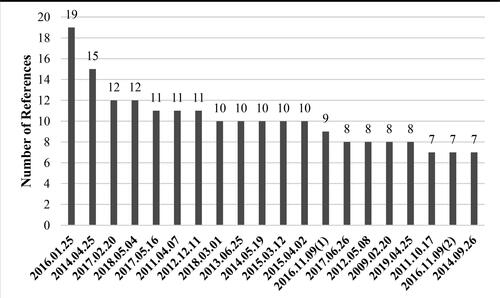
Figure 6. Tree Map of ‘Financing process management’Footnote12.
Source: drawn by the authors based on NVivo.11 software.
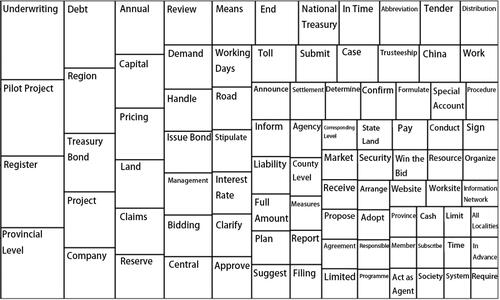
Figure 7. Risk management.
Source: drawn by the authors based on NVivo.11 software.
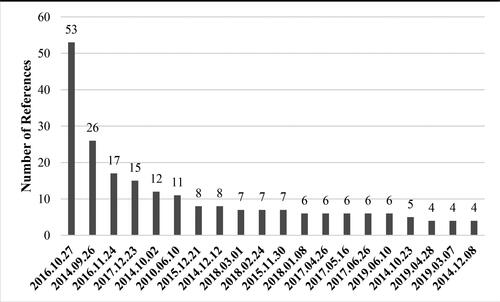
Figure 8. Fund usage management.
Source: drawn by the authors based on NVivo.11 software.
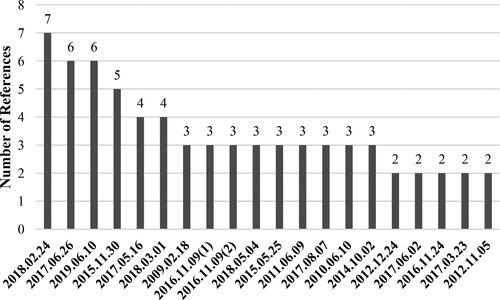
Figure 9. Tree Map of ‘Fund usage management’.
Source: drawn by the authors based on NVivo.11 software.
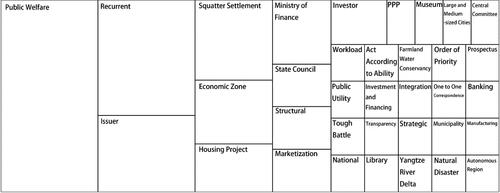
Figure 10. Compliance regime management.
Source: drawn by the authors based on NVivo.11 software.
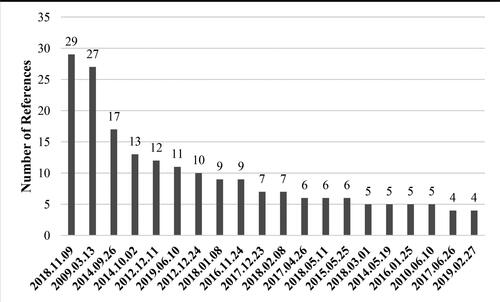
Figure 11. Limit management.
Source: drawn by the authors based on NVivo.11 software.
Figure 12. Budget management.
Source: drawn by the authors based on NVivo.11 software.
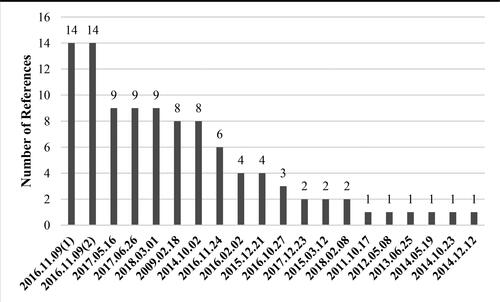
Figure 13. Market mechanism.
Source: drawn by the authors based on NVivo.11 software.
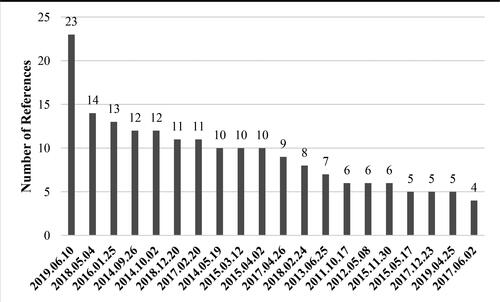
Figure 14. Tree Map of ‘Responsibility mechanism’.
Source: drawn by the authors based on NVivo.11 software.
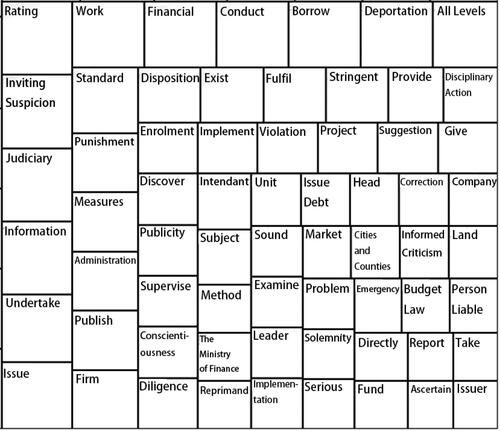
Figure 15. Coordination mechanism.
Source: drawn by the authors based on NVivo.11 software.
Figure 16. Matrix coding query.
Source: drawn by the authors based on NVivo.11 software.
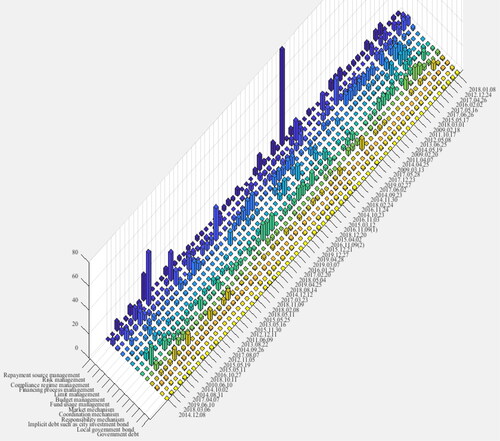
Figure 17. Source comparison by the number of references.
Source: drawn by the authors based on NVivo.11 software.
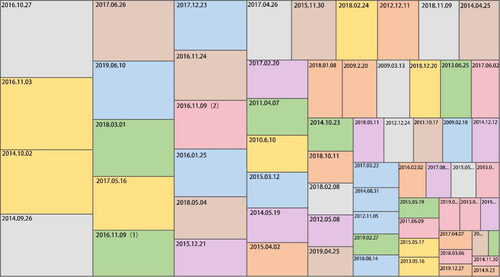
Figure 18. Cluster analysis according to word similarity.
Source: drawn by the authors based on NVivo.11 software.
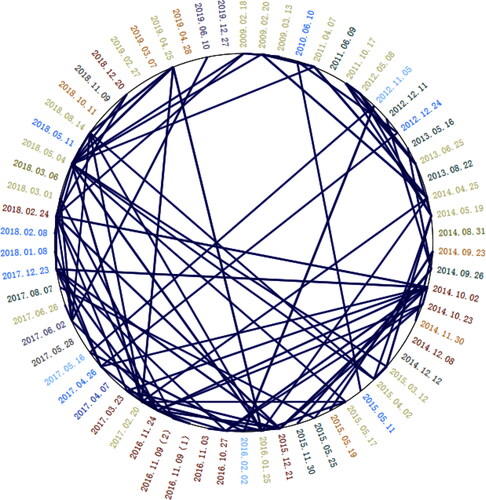
Figure 19. Social network analysis of policy texts.
Source: drawn by the authors based on NVivo.11 software.
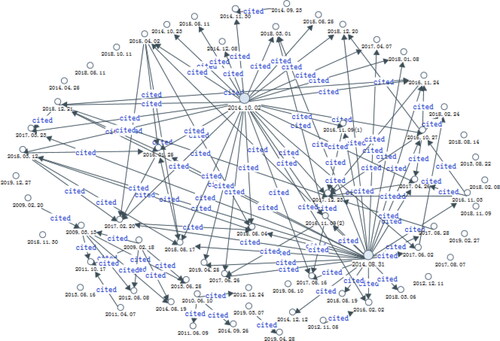
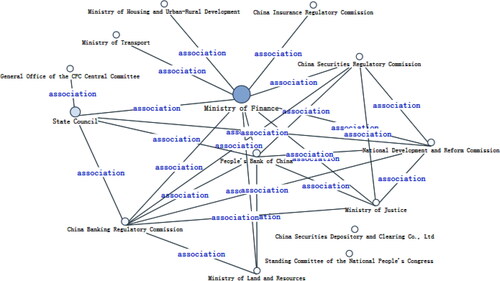
Figure 20. Social network analysis of issuing departments.
Source: drawn by the authors based on NVivo.11 software.