
Figures & data
Table 1. Consumer survey data: 1988Q1–2016Q4.
Figure 1. Growth in real durables spending (real-time data): 1988Q1–2016Q4.
Source: Author’s calculation.
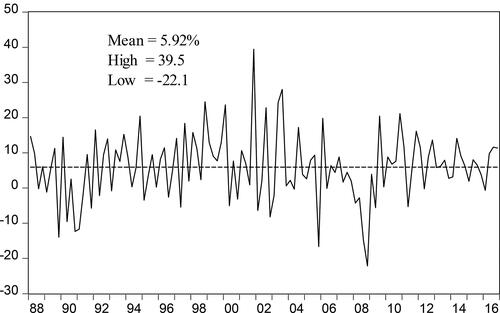
Figure 2. Federal reserve forecast errors.
Source: Author’s calculation.
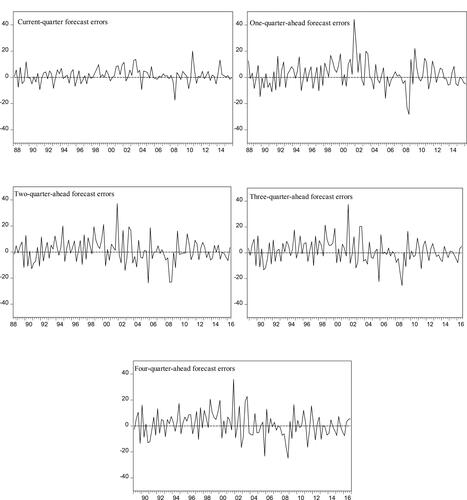
Table 2. Federal Reserve forecast accuracy results.
Table 3. Orthogonality test results.
Table 4. Knowledge model (KM) estimates of growth in durables spending.
Table 5. Encompassing test results.
Table 6. Mean absolute errors (MAE) of alternative forecasts.
Table 7. Accuracy results of the combined (PCt+f) forecasts.