
Figures & data
Figure 1. The two-stage model of self-control and income.
Source: Adapted from Myrseth and Fishbach (Citation2009).
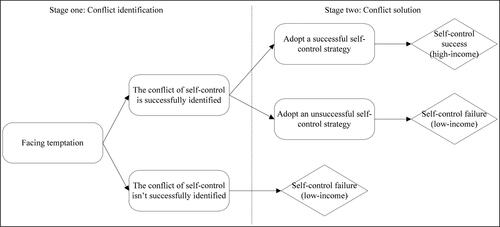
Figure 2. The dual-systems model of self-control and income.
Source: Adapted from Hofmann et al. (Citation2009).
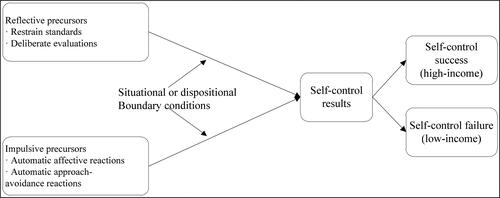
Table 1. Definition of variables and descriptive statistics.
Table 6. Conley et al. (Citation2012) plausibly exogenous bounds.
Figure 3. Moderating effect of age and gender on the impact of self-control on income.
Source: created by authors.
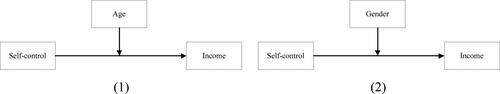
Figure 4. Mediating effect of education on the impact of self-control on income.
Source: created by authors.
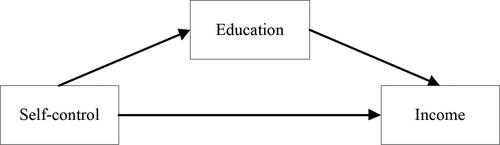
Figure 5. Average annual income of individuals with different levels of self-control.
Source: created by authors.
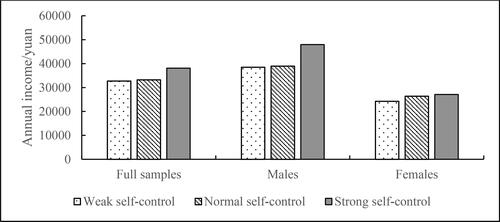
Table 2. Impact of self-control on income.
Figure 6. The average marginal effect of self-control on income with different age.
Source: created by authors.
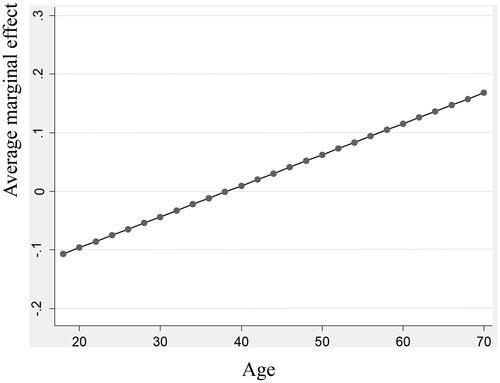
Figure 7. Average marginal effect of self-control on income for males and females.
Note: On the x-axis, 0 represents women, and 1 represents men.
Source: created by authors.
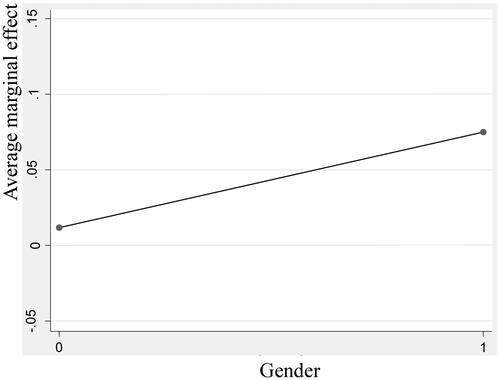
Table 3. Mediating effect of education in self-control impacting income.
Table 4. IV-quantile regression of impact of self-control on income.
Table 5. IV-2SLS regression of sub-sample with self-control as classification criterion.
Table 7. Impact of self-control on income using the CLDS2016 data.
Table 8. Impact of self-control on wage income using data of 2016.