
Figures & data
Figure 1. Variable relationships.
Source: Authors.
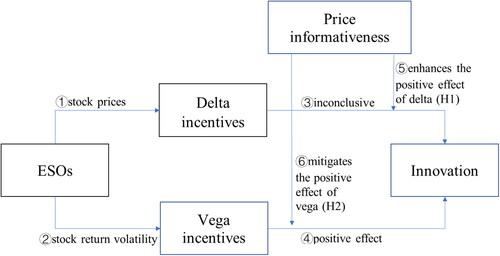
Table 1. Summary statistics and observation selection.
Table A4. Variable definitions.
Table A2. Correlation tests.
Table A3. Continuous patent proxies.
Table 2. The relationship between ESOs’ incentives and innovation.
Table 3. Alternative informative price dummy variable.
Table 4. The lagged levels.
Table 5. IV regressions.
Table A1. The first stage regression.
Table 6. Alternative proxies of price informativeness.
Table 7. Deep-in-the-money options.
Table 8. Subsample analysis.
Table 9. Noise traders, price informativeness and stock return volatility.
Data availability statement
Raw data were generated at Shenzhen SCMAR Data Technology Co., Ltd. Derived data supporting the findings of this study are available from the corresponding author on request.