Figures & data
Table 1. Variable description and data sources.
Table 2. Shapiro–Wilk W test for normal data.
Table 3. V.I.F. and Breusch–Pagan/Cook–Weisberg test for heteroskedasticity.
Table 4. Results of unit root tests.
Table 5. Long-run results of regression.
Table 6. Results of country-wise P.Q.R.
Table 7. Results of Granger causality.
Table 8. Hausman, Breusch, and Pagan Lagrangian multiplier test for model validation.
Table 9. Results of selected indicators based on the T.O.P.S.I.S. method.
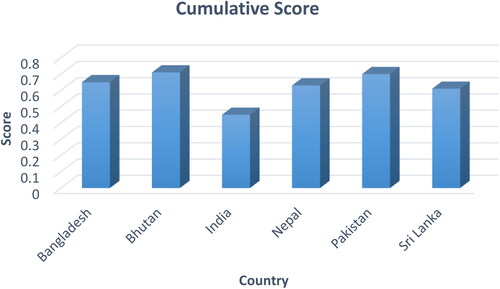
Figure 1. Cumulative score of South Asian based on T.O.P.S.I.S.
Authors calculations based on STATA.