
Figures & data
Figure 1. Energy use in E7 economies between 1965 and 2017.
Source: B.P. Statistical Review (Citation2018).
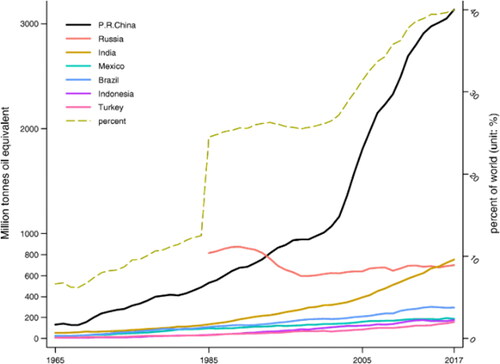
Table 1. Variables' description and sources.
Table 2. Normality check and descriptive statistics.
Table 3. Slope heterogeneity and cross-section dependence.
Table 4. Unit root testing (Pesaran, Citation2007).
Table 5. Cointegration results (Westerlund-2007).
Table 6. Panel quantile regression results.
Table 7. Causality check.