
Figures & data
Figure 1. Research model.
Data Source: This Paper.
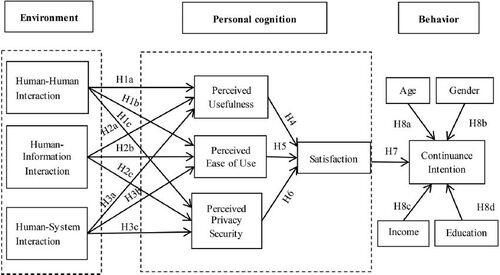
Table 1. Measurement model statistics.
Table 2. Construct correlations and square roots of average variance extracted.
Table 3. HTMT test results.
Figure 2. Results of structural equation modeling analysis of the hypothesized model.
Note: *p<0.05; **p<0.01; ***p<0.001; ns, non-significant.
Data Source: This Paper.
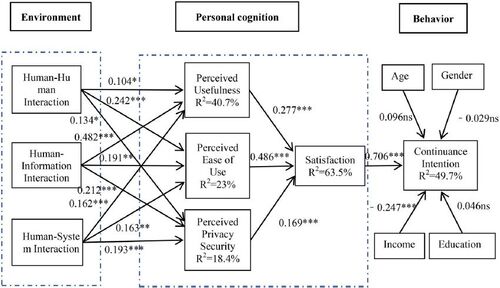
Table 4. Results of study hypotheses testing.