
Figures & data
Table 1. Demographics of sample countries.
Table 2. Announcement dates of each event.
Table 3. Reported number of COVID cases and deaths.
Figure 1. Average abnormal return (AAR) and polynomial regression of major event Window for developed countries.
Source: Authors calculation.
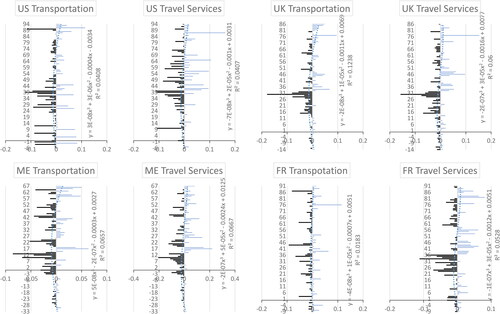
Figure 2. Average abnormal return (AAR) and polynomial regression of major event Window for developing countries.
Source: Authors calculation.
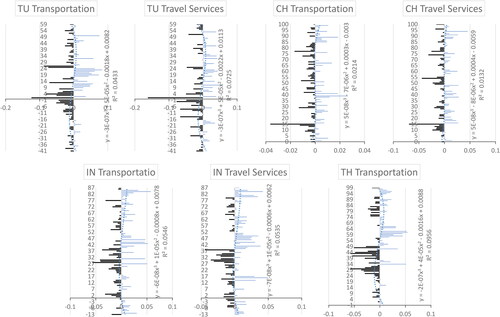
Table 4. CAAR and ABHAR during January 10, 2020, to May 31, 2020.
Table 5. Major events and CAAR of transportation sector.