
Figures & data
Figure 1. The trend of return and likelihood ration (a) Wti (b) GasNyh (c) Heat (d) Dj (e) Nasdaq (f) Sp500.
Source: Author.
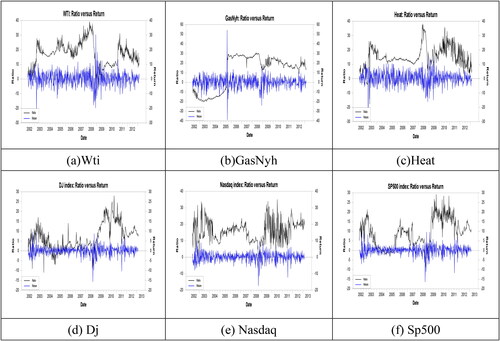
Table 1. Descriptive statistics of daily return for the overall, pre-SB and post-SB periods.
Table 2. Empirical results of B-GJR-GARCH-SB model for the Oil-stock paired market data.
Table 3. Empirical results of B-GJR-GARCH-SB model for the Oil-FX and Stock-FX types of paired market data.
Table 4. The summary results of return spillover for 15 pairs of data.
Table 5. The summary results of volatility spillover effect for 15 pairs of data.
Table 6. The summary results of correlation for 15 pairs of data.
Table 7. The summary results of risk premium for 15 pairs of data.
Table 8. The summary results of leverage effect for 15 pairs of data.