
Figures & data
Table 1. Descriptive Statistics and Normality Test.
Table 2. Augmented Dickey-Fuller test.
Figure 1. Quantiles on Quantiles Regression CO2-FFC.
Note: The z-axis indicates the coefficient values, the x-axis indicates FFC, and the y-axis represents CO2
Source: Authors own estimation on data obtained from given sources.
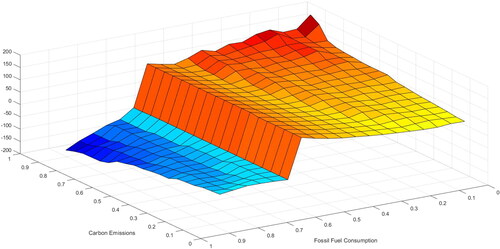
Figure 2. Quantiles on Quantiles Regression CO2-GDP.
Note: The z-axis indicates the coefficient values, the x-axis indicates CO2, and the y-axis represents GDP.
Source: Authors own estimation on data obtained from given sources.
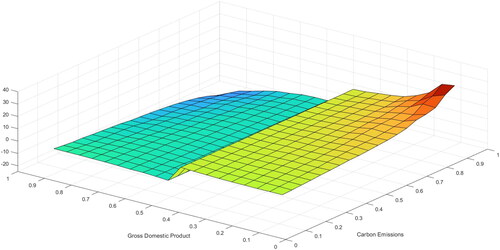
Figure 3. Quantiles on Quantiles Regression GDP-FFC.
Note: The z-axis indicates the coefficient values, the x-axis indicates FFC, and the y-axis represents GDP.
Source: Authors own estimation on data obtained from given sources.
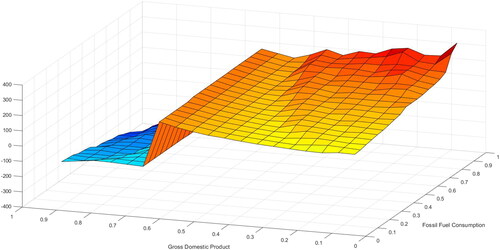
Table 3. Granger-Causality Test.