
Figures & data
Figure 1. Spatial distribution of GGR for selected years.
Source: Self-Calculated following Section 3.
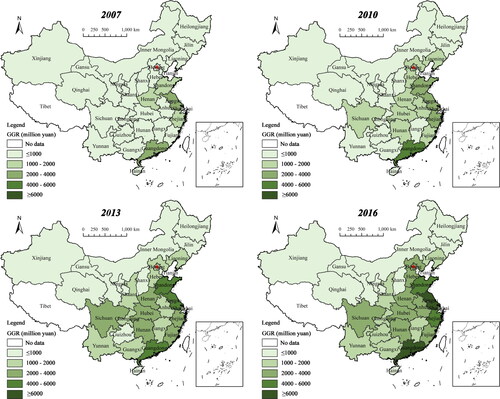
Figure 2. Spatial distribution of GTR and GEN for selected years.
Source: Self-Calculated according to CCIED (2017) and CSY (2020).
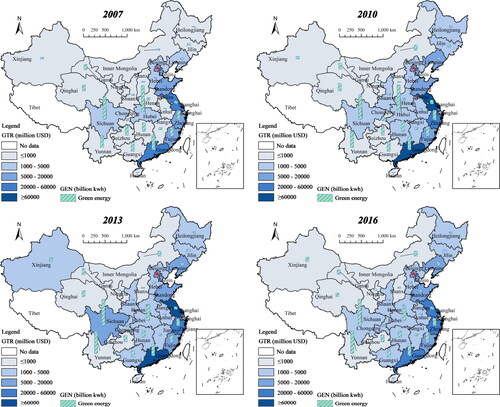
Figure 3. Average GTR, GEN, IMG, and EXG of China.
Source: Self-Calculated according to CCIED (2017) and CSY (2020).
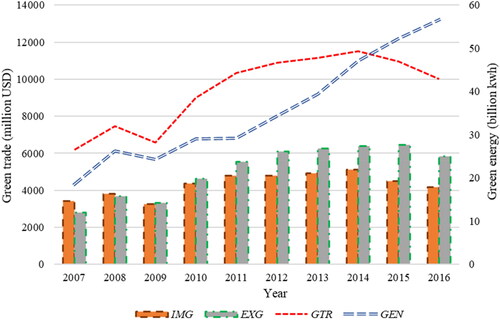
Table 1. Descriptive statistics of the variables.
Table 2. Results of the cross-sectional dependence tests.
Table 3. Results of the GTR, GEN, and GGR nexus.
Table 4. Results of the products’ heterogeneous analysis.
Figure 4. Regional division based on GTR and GEN.
Source: Self-Calculated.
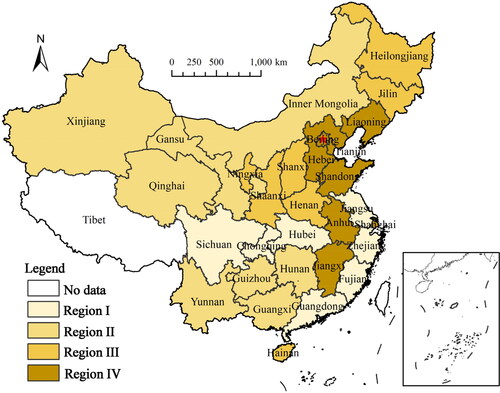
Table 5. Results of the regional heterogeneous analysis.
Figure 5. Coefficients of quantile regression.
Notes: The conditional quantiles of GGR is shown in the x-axis; various variables are shown by the y-axis.
Source: Self-Calculated.
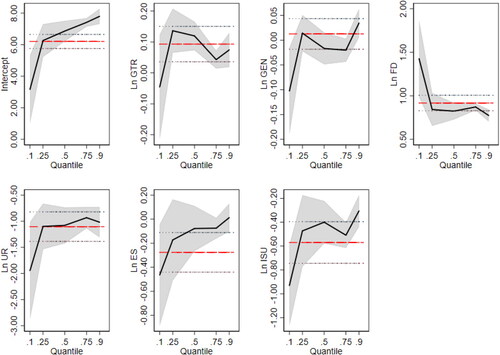
Table 6. Results of the quantile regression.
Table 7. Results of the mechanism analysis.
Figure 6. Mediating mechanism of GTR on GGR.
Source: Self-Calculated.
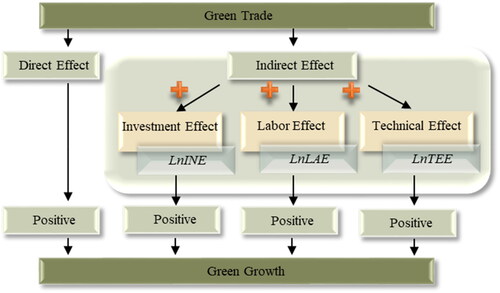
Table A1. List of abbreviations.
Data availability statement
The data that support the findings of this study are available from the corresponding author upon reasonable request.