Figures & data
Figure 1. Ward cluster dendrograms for several European countries: (a) Bulgaria; (b) Spain; (c) France; (d) Romania; (e) Sweden; (f) Portugal.
Source: Outputs obtained in R software.
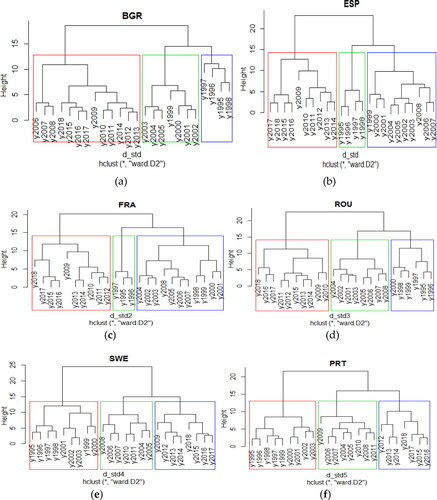
Table 1. The synthesis of the main results using k-means algorithm for each country.
Figure 2. Classes’ evolution for European countries.
Source: Authors’ processing based on the output from R software.
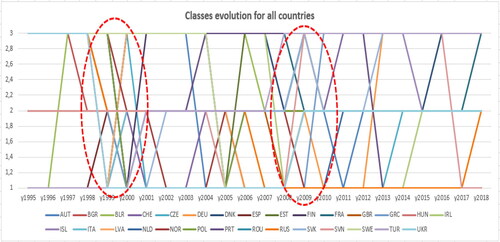
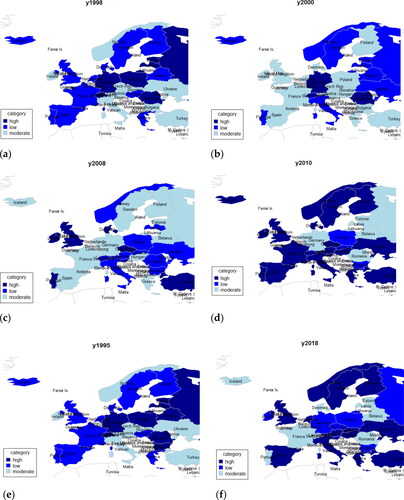
Figure 3. Recession risk in time: (a) 1998; (b) 2000; (c) 2008; (d) 2010; (e) 1995; (f) 2018.
Source: Outputs obtained in R software.