Figures & data
Figure 1. The number of novel projects for PPP library at the end of September.
Source: calculated from authors.
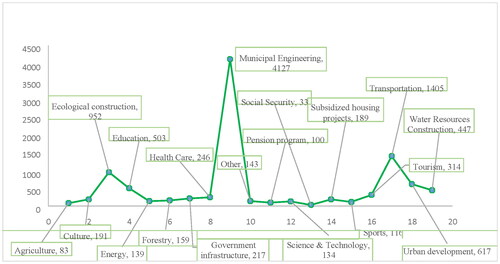
Table 1. The comparison of different techniques.
Table 2. The payoff matrix with preference view.
Table 3. The payoff matrix with equivocators.
Table 4. The risk allocation of CRFs.
Figure 2. The partners structure of the Lintong line.
Source: calculated from authors.
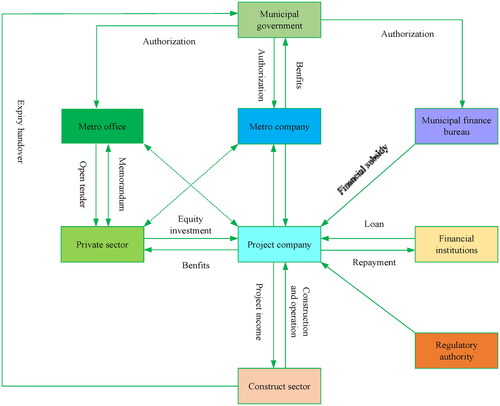
Table 5. The benefits of different partners in three aspects.
Table 6. The cost of partners in three aspects.
Table 7. The data of different partners in allocating market risk.
Table 8. The payoff matrix with preference view.
Table 9. The payoff matrix with equivocators.
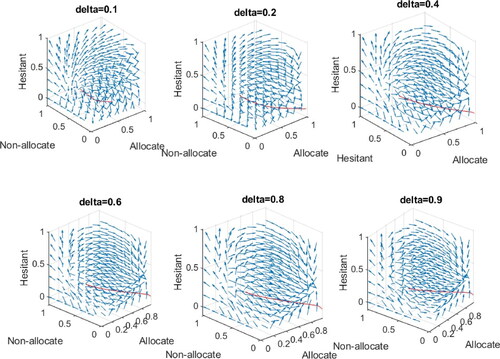
Figure 3. The dynamic graph with preference view game model of the government.
Source: calculated from authors.
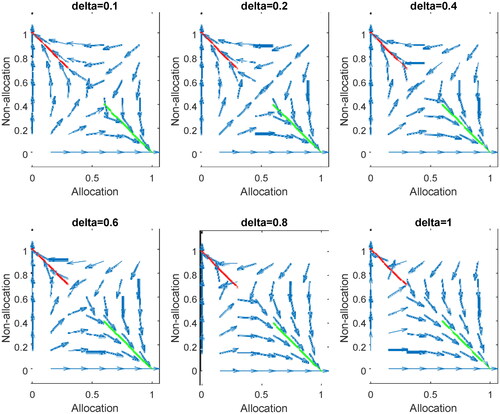
Figure 4. The dynamic graph with preference view game model of the private.
Source: calculated from authors.
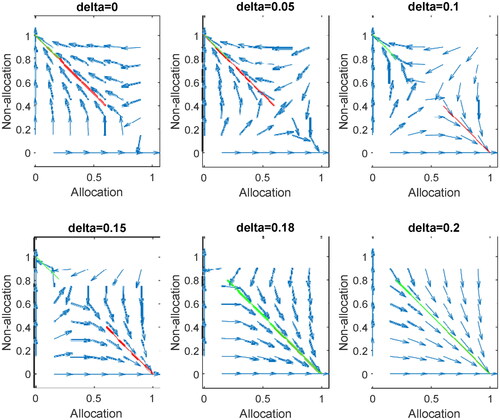
Figure 5. The dynamic graph with equivocators game model of the government.
Source: calculated from authors.
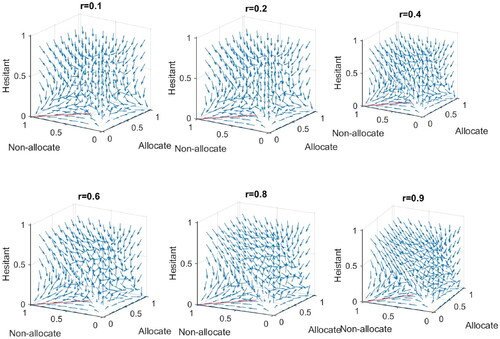
Figure 6. The dynamic graph of the government with equivocators model.
Source: calculated from authors.
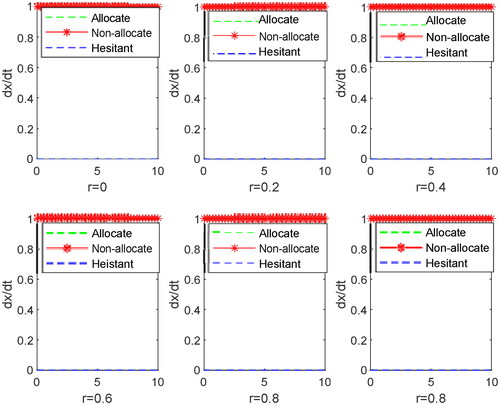
Table 10. The matrix with preference view and equivocators.
Table 11. The payoff matrix with preference view and equivocators.
Figure 7. The dynamic graph with preference view and equivocators game model of the government.
Source: calculated from authors.
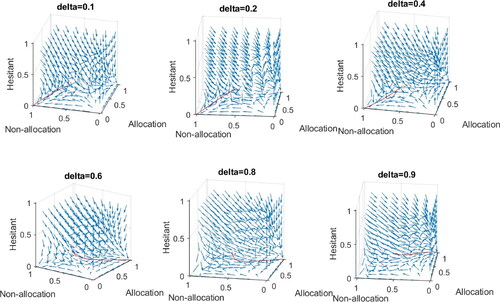
Figure 8. The dynamic graph with preference view and equivocators game model of the private.
Source: calculated from authors.