
Figures & data
Table 1. Definition and measurement of control variables.
Figure 1. The transaction amount from 2000 to 2019 in China.
This figure shows the M&A transaction amount from 2000 to 2019 in the Chinese market.
Source: the data is from http://www.cvsource.com.cn/
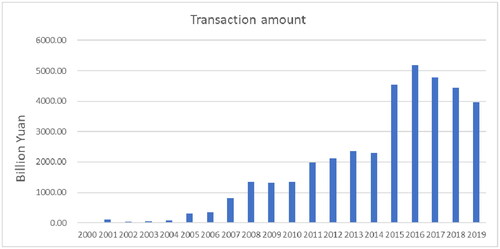
Table 2. The number of acquisitions.
Table 3. Summary statistics of CAR.
Table 4. Correlation analysis of major variables.
Table 5. The effect of corporate social ties on M&A performance.
Table 6. Regression results under different corporate governance environments.
Table 7. The effect of corporate social ties on the target retention.
Table 8. The effect of corporate social ties on the M&A performance.
Table 9. The moderating effect of corporate governance.
Table A1. Summary statistics of the control variables.