
Figures & data
Figure 1. Correlation between tax structure and tax complexity.
Notes: Tax_struc_1 and Tax_struc_2 represent the proportion of direct taxes in tax revenues and the ratio of direct to indirect taxes, respectively. Tax complexity is calculated using the sum of the squares of the total tax revenue proportion of each tax revenue and then taking its reciprocal.
Source: Authors’ Estimation.
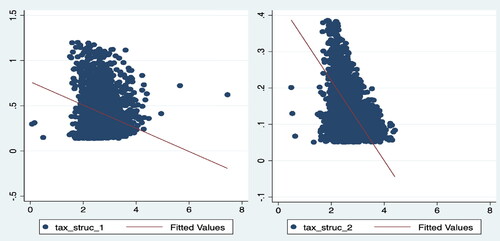
Table 1. Summary of statistics.
Table 2. Baseline results: fixed effect.
Table 3. Robustness: national income accounting method.
Table 4. Regression with new variables and different time intervals.
Table 5. Replacement of the interpreted variable.
Table 6. Considering the full sample with negative profits.
Table 7. Instrumental variable method.
Table 8. Impact mechanism.