
Figures & data
Table 1. Average revenue and net earnings of the airline industry.
Figure 1. Trends in airline industry during the pre-pandemic period.
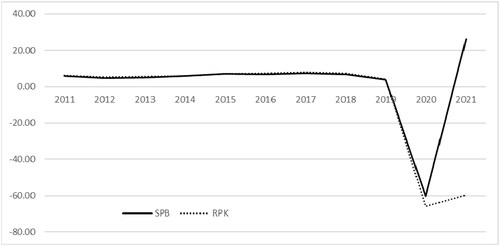
Table 2. Details of the sample.
Figure 2. Event timeline.
Source: Drawn by authors
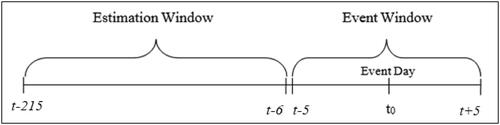
Table 3. Summary statistics of the daily log returns during the estimation and event window period.
Table 4. Average and cumulative average abnormal returns and the corresponding t-values during the event window for the entire sample (N = 34).
Figure 3. Trend of AARs and CAARs during the event window for the entire sample.
Source: Drawn by the authors based on the results of the event study analysis
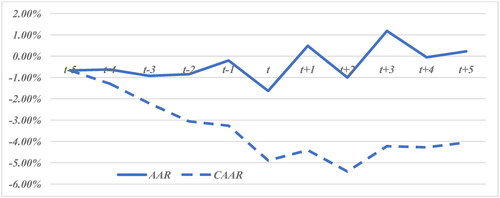
Table 5. Country-wise shorter window cumulative average abnormal returns and the corresponding t-values.
Table 6. Shorter window cumulative average abnormal returns and the corresponding t-values for the entire sample.
Data availability statement
The data used in this study has been made available at Mendeley Data at Pandey and Kumari (Citation2021).