
Figures & data
Table 2. The effects of T.P.U. on trade flow based on income heterogeneity.
Table 1. The impacts of T.P.U. on trade (baseline).
Table 3. The effects of T.P.U. on non-manufacture trade.
Table 4. The effects of T.P.U. on trade flow (developing-developing pair).
Table 5. The impacts of T.P.U. on trade flow (P.P.M.L.).
Table 6. Simulation results.
Figure B1. The average export of top exporters among emerging economies (2001–2019).
Source: Authors' calculations from U.N. Comtrade database.
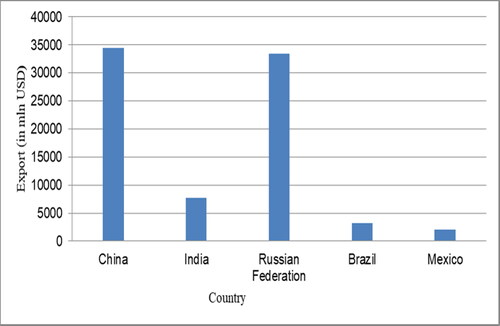
Figure B2. T.P.U. of developed and developing countries.
Source: Authors' calculations based on E.P.U index by Ahir et al. (Citation2018).
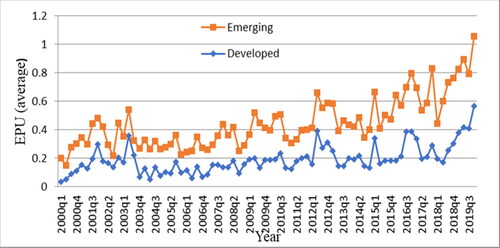
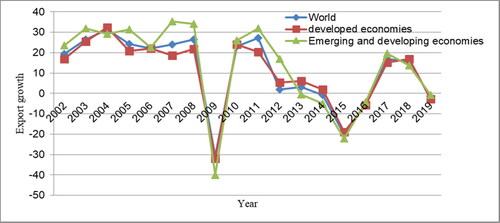
Figure B3. T.P.U. and trade performance. a. T.P.U. change. b. Export growth.
Source: Authors' calculations based on E.P.U index by Ahir et al. (Citation2018).
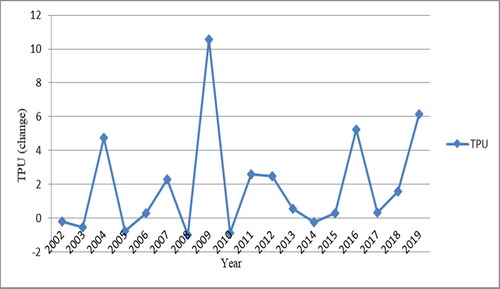
Figure B4. Trade performance of low-income countries.
Source: Authors' calculations from U.N. Comtrade database.
Data availability statement
The data used in this study are available from the corresponding author whenever requested.