
Figures & data
Table 1. Descriptive statistics.
Table 2. Correlation matrix.
Figure 1. Influence statistics.
Source: Authors’ estimate.
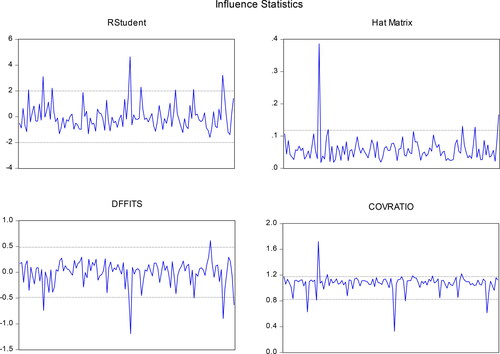
Figure 2. Leverage plots.
Note: EPC shows carbon emissions per capita, BEDI shows the business extent to discourse index, CBSP shows the cost of business start-up procedures, EDB shows the ease of doing business, LPI shows logistics performance index, FIMP shows fuel imports, and REC shows renewable energy consumption.
Source: Author’s estimation.
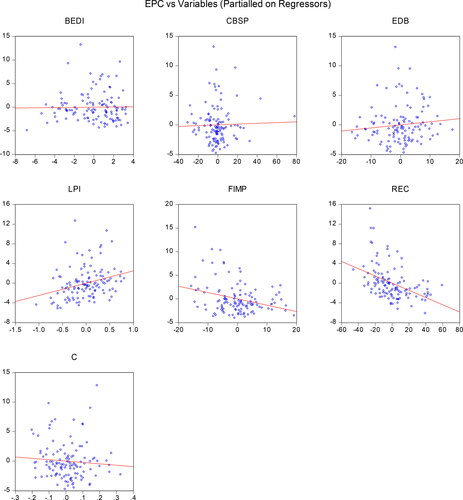
Table 3. Cross-sectional regression estimates.
Figure 3. CUSUM and CUSUM square estimates.
Source: Author’s estimates.
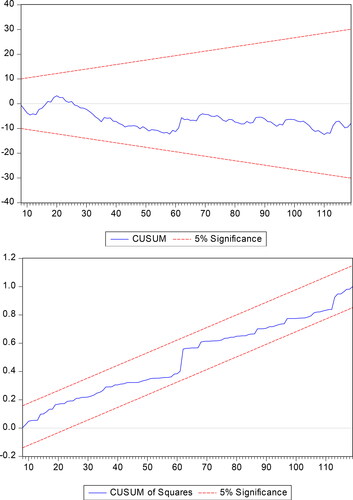
Table 4. Impulse response estimates of EPC.
Table 5. Variance decomposition analysis of EPC.
Table A1. List of countries.