
Figures & data
Figure 1. The university as an optimal open system.
Source: adaptation after (Dedita, Citation2015).
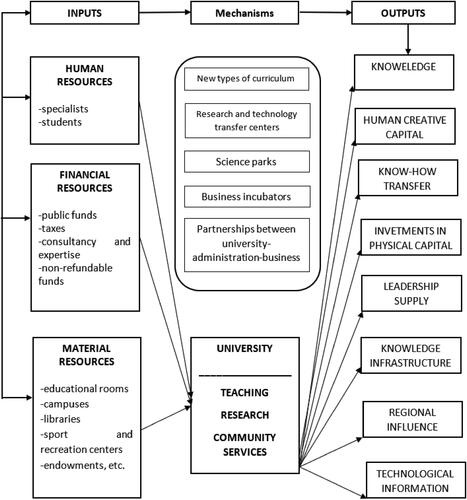
Table 1. Correlation matrix between the main research variables.
Table 2. Correlation matrix for the main research variables.
Table 3. Rotated component matrix.
Table 4. Rotated component matrix.
Table 5. Rotated component matrix.
Table 6. Rotated component matrix.
Table 7. Model summary.
Table 8. Variables in the equation.