
Figures & data
Table 1. Descriptive statistics of returns.
Table 2. Unit root test with structural break.
Table 3. Markov switching model for stock indices.
Table 4. Markov switching model for exchange rates.
Table 5. Markov switching model for minerals.
Table 6. Markov switching model for metals.
Figure 1. Bartlett Periodogram white noise test results for selected series.
Source: authors’ calculation.
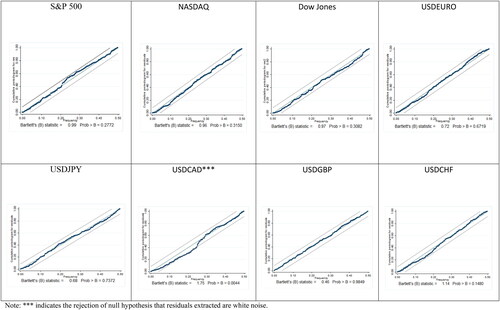
Figure A1. Scatter plot of model standardised residuals.
Note: *** indicates the rejection of null hypothesis that residuals extracted are white noise.
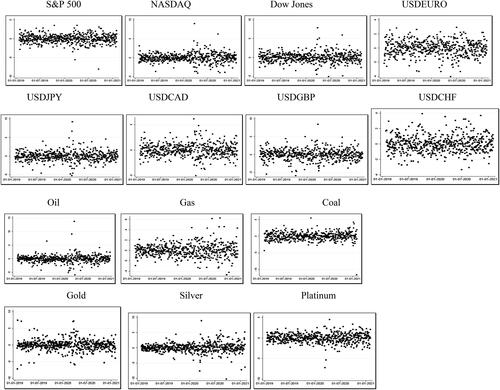
Table A1. Daily returns series name.